OPEN-SOURCE SCRIPT
MA 250 & 1250 + Overextension
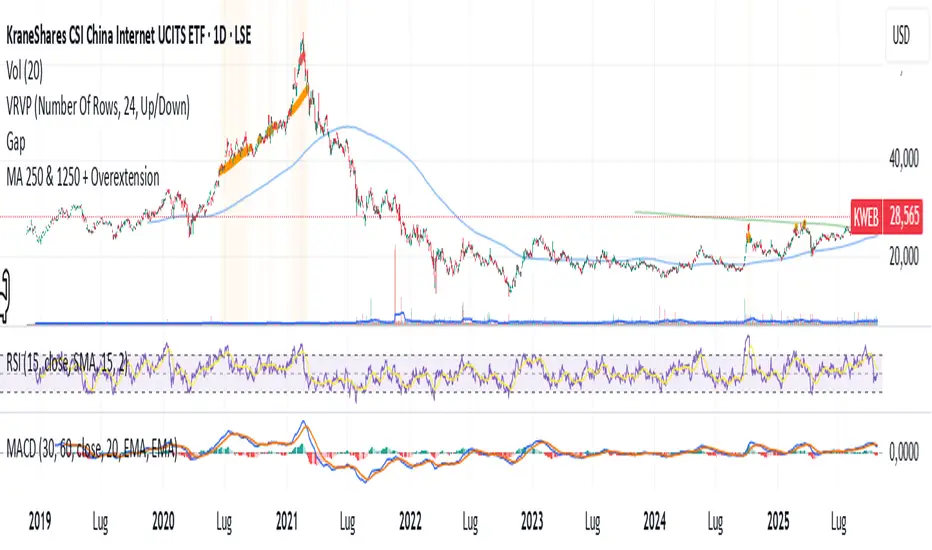
This indicator is designed for long-term and macro traders who use moving averages to identify structural support levels and potential overextended tops.
It plots two key simple moving averages:
While the 1250-day MA often acts as strong support during major market bottoms, the 250-day MA serves as a dynamic reference for identifying potential tops.
The core innovation of this script is the addition of user-defined overextension zones above the 250-day MA:
You can independently choose which background zone to display:
Visual cues include:
Use cases:
Note: This tool does not generate buy/sell signals on its own. It is intended as a contextual filter to complement price action, volume, momentum, and macro analysis.
It plots two key simple moving averages:
- 250-day SMA (≈1-year average)
- 1250-day SMA (≈5-year average)
While the 1250-day MA often acts as strong support during major market bottoms, the 250-day MA serves as a dynamic reference for identifying potential tops.
The core innovation of this script is the addition of user-defined overextension zones above the 250-day MA:
- +30% zone: highlights potential cyclical tops (ideal for less volatile assets)
- +50% zone: marks extreme overextension levels (useful for volatile instruments)
You can independently choose which background zone to display:
- "+30% only"
- "+50% only"
- "Both" (with +50% taking visual priority)
- "None"
Visual cues include:
- Colored circles when price enters each overextension zone
- Optional semi-transparent background highlighting active zones
- Clean, non-repainting logic based on closing prices
Use cases:
- Confirming structural support near the 1250-day MA during deep corrections
- Assessing risk/reward when price moves far above the 250-day MA
- Avoiding late long entries in euphoric market phases
- Identifying potential distribution zones in long-term uptrends
Note: This tool does not generate buy/sell signals on its own. It is intended as a contextual filter to complement price action, volume, momentum, and macro analysis.
Skrip open-source
Dengan semangat TradingView yang sesungguhnya, penulis skrip ini telah menjadikannya sumber terbuka, sehingga para trader dapat meninjau dan memverifikasi fungsinya. Hormat untuk penulisnya! Meskipun anda dapat menggunakannya secara gratis, ingatlah bahwa penerbitan ulang kode tersebut tunduk pada Tata Tertib kami.
Pernyataan Penyangkalan
Informasi dan publikasi tidak dimaksudkan untuk menjadi, dan bukan merupakan saran keuangan, investasi, perdagangan, atau rekomendasi lainnya yang diberikan atau didukung oleh TradingView. Baca selengkapnya di Persyaratan Penggunaan.