OPEN-SOURCE SCRIPT
Diupdate Future SD Projection
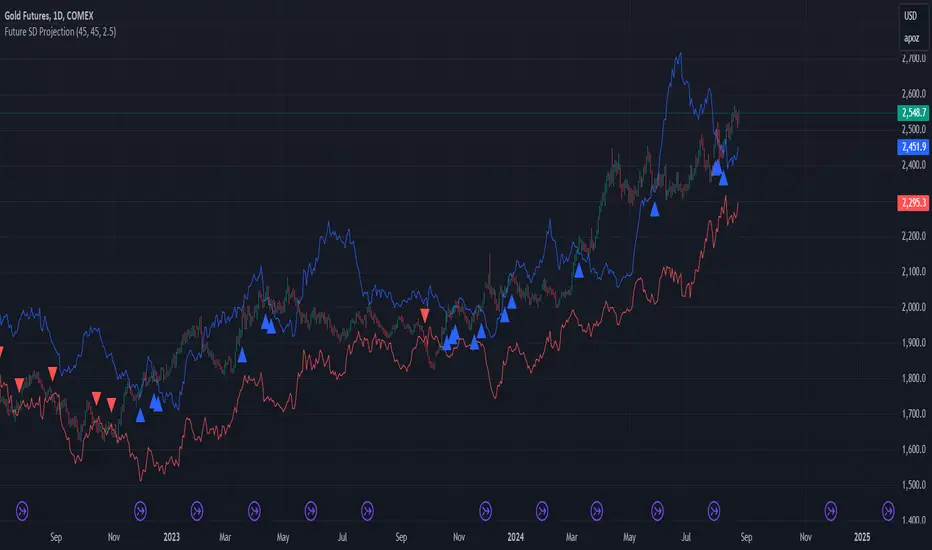
Future Standard Deviation Projector
This innovative indicator projects price volatility into the future, helping traders anticipate potential price ranges and breakouts. It calculates standard deviation bands based on recent price action and extends them forward, providing a unique perspective on future price movement possibilities.
Key Features:
- Projects standard deviation bands into the future
- Customizable lookback period for volatility calculation
- Adjustable future projection timeframe
- Flexible standard deviation multiplier
- Clear visual signals for band breaches
How it works:
1. Calculates standard deviation from recent closing prices
2. Projects upper and lower bands into the future
3. Plots these bands on the chart
4. Signals with arrows when closing price crosses projected bands
Use this indicator to:
- Gauge potential future price ranges
- Identify possible breakout levels
- Assess market volatility expectations
- Enhance your trading strategy with forward-looking volatility projections
Customize the settings to align with your trading timeframe and risk tolerance. Remember, while this tool offers valuable insights, it should be used in conjunction with other analysis methods for comprehensive trading decisions.
Note: Past performance and projections do not guarantee future results. Always manage your risk appropriately.
Catatan Rilis
Future Standard Deviation ProjectorThis innovative indicator projects price volatility into the future, helping traders anticipate potential price ranges and breakouts. It calculates standard deviation bands based on recent price action and extends them forward, providing a unique perspective on future price movement possibilities.
Key Features:
- Projects standard deviation bands into the future
- Customizable lookback period for volatility calculation
- Adjustable future projection timeframe
- Flexible standard deviation multiplier
- Clear visual signals for band breaches
How it works:
1. Calculates standard deviation from recent closing prices
2. Projects upper and lower bands into the future
3. Plots these bands on the chart
4. Signals with arrows when closing price crosses projected bands
Use this indicator to:
- Gauge potential future price ranges
- Identify possible breakout levels
- Assess market volatility expectations
- Enhance your trading strategy with forward-looking volatility projections
Customize the settings to align with your trading timeframe and risk tolerance. Remember, while this tool offers valuable insights, it should be used in conjunction with other analysis methods for comprehensive trading decisions.
Note: Past performance and projections do not guarantee future results. Always manage your risk appropriately.
Skrip open-source
Dengan semangat TradingView yang sesungguhnya, pembuat skrip ini telah menjadikannya sebagai sumber terbuka, sehingga para trader dapat meninjau dan memverifikasi fungsinya. Salut untuk penulisnya! Meskipun Anda dapat menggunakannya secara gratis, perlu diingat bahwa penerbitan ulang kode ini tunduk pada Tata Tertib kami.
Pernyataan Penyangkalan
Informasi dan publikasi ini tidak dimaksudkan, dan bukan merupakan, saran atau rekomendasi keuangan, investasi, trading, atau jenis lainnya yang diberikan atau didukung oleh TradingView. Baca selengkapnya di Ketentuan Penggunaan.