OPEN-SOURCE SCRIPT
Prior sessions High/Low/Mid
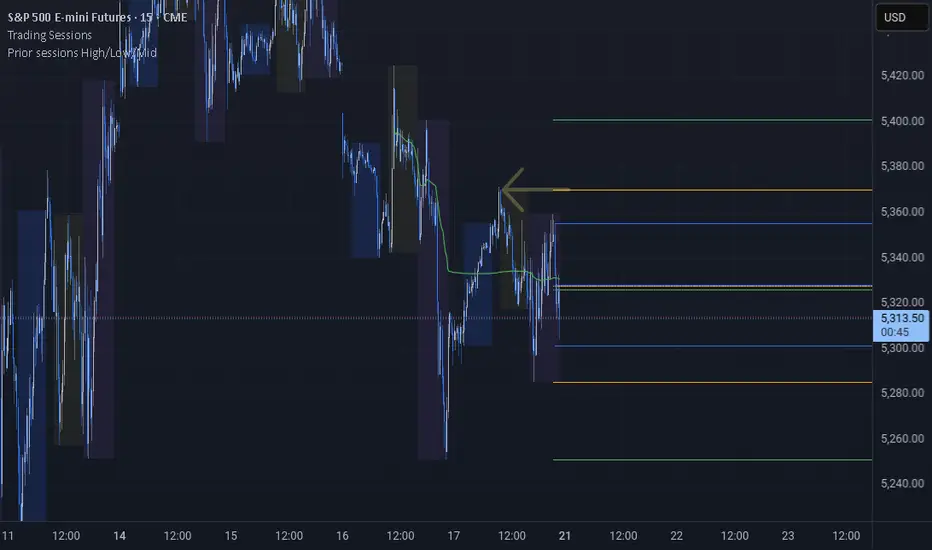
This indicator highlights the High, Low, and Midpoint of the most recently completed trading sessions. It helps traders visualize key price levels from the previous session that often act as support, resistance, or reaction zones.
It draws horizontal lines for the high and low of the last completed session, as well as the midpoint, which is calculated as the average of the high and low. These lines extend to the right side of the chart, remaining visible as reference levels throughout the day.
You can independently enable or disable the Tokyo, London, and New York sessions depending on your preferences. Each session has adjustable start and end times, as well as time zone settings, so you can align them accurately with your trading strategy.
This indicator is particularly useful for intraday and swing traders who use session-based levels to define market structure, bias, or areas of interest. Session highs and lows often align with institutional activity and can be key turning points in price action.
Please note that this script is designed to be used only on intraday timeframes such as 1-minute to 4-hour charts. It will not function on daily or higher timeframes.
Skrip open-source
Dengan semangat TradingView yang sesungguhnya, pembuat skrip ini telah menjadikannya sebagai sumber terbuka, sehingga para trader dapat meninjau dan memverifikasi fungsinya. Salut untuk penulisnya! Meskipun Anda dapat menggunakannya secara gratis, perlu diingat bahwa penerbitan ulang kode ini tunduk pada Tata Tertib kami.
Pernyataan Penyangkalan
Informasi dan publikasi ini tidak dimaksudkan, dan bukan merupakan, saran atau rekomendasi keuangan, investasi, trading, atau jenis lainnya yang diberikan atau didukung oleh TradingView. Baca selengkapnya di Ketentuan Penggunaan.