OPEN-SOURCE SCRIPT
AUTO STOP LEVEL

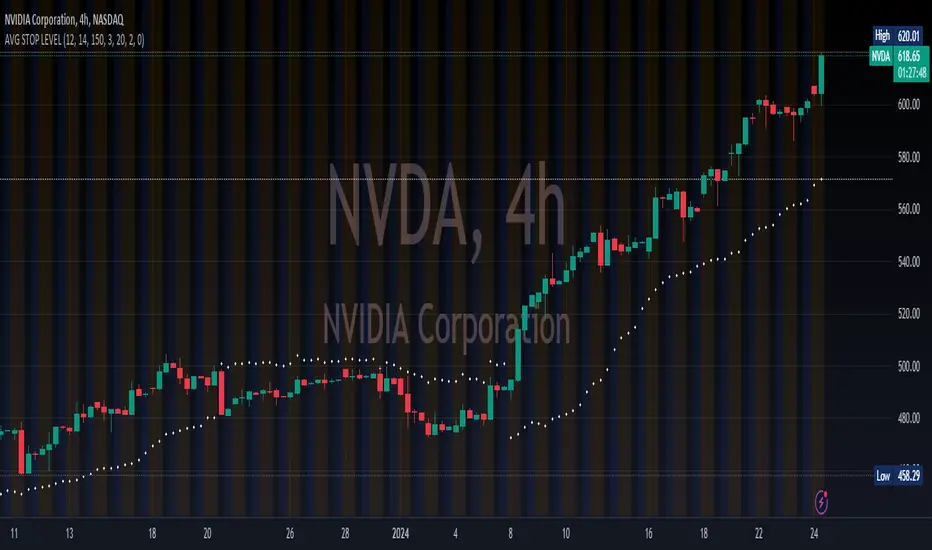
This is a simple yet highly efficient code that calculates stop levels, taking into account the market trend and its volatility.
This script calculates and displays (as a white point in the chart) a stop-loss by considering both volatility and the nearest support/resistance point.
The stop level is determined as the average of three specific values: firstly, two distinct volatility indicators - ATR and Bollinger Bands, and finally, the nearest support/resistance provided by the Supertrend indicator.
Moreover, it analyzes the trend to determine whether the stop should be set for long or short positions, providing insights into the most probable path of future prices. For instance, if the calculated stop level is below the current market prices, it suggests taking long positions, and vice versa.
Customization options include fine-tuning the standard parameters for the three indicators used in averaging and selecting multiple time frames.
Skrip open-source
Dengan semangat TradingView yang sesungguhnya, pembuat skrip ini telah menjadikannya sebagai sumber terbuka, sehingga para trader dapat meninjau dan memverifikasi fungsinya. Salut untuk penulisnya! Meskipun Anda dapat menggunakannya secara gratis, perlu diingat bahwa penerbitan ulang kode ini tunduk pada Tata Tertib kami.
Pernyataan Penyangkalan
Informasi dan publikasi ini tidak dimaksudkan, dan bukan merupakan, saran atau rekomendasi keuangan, investasi, trading, atau jenis lainnya yang diberikan atau didukung oleh TradingView. Baca selengkapnya di Ketentuan Penggunaan.