PROTECTED SOURCE SCRIPT
Diupdate Timeframe Continuity
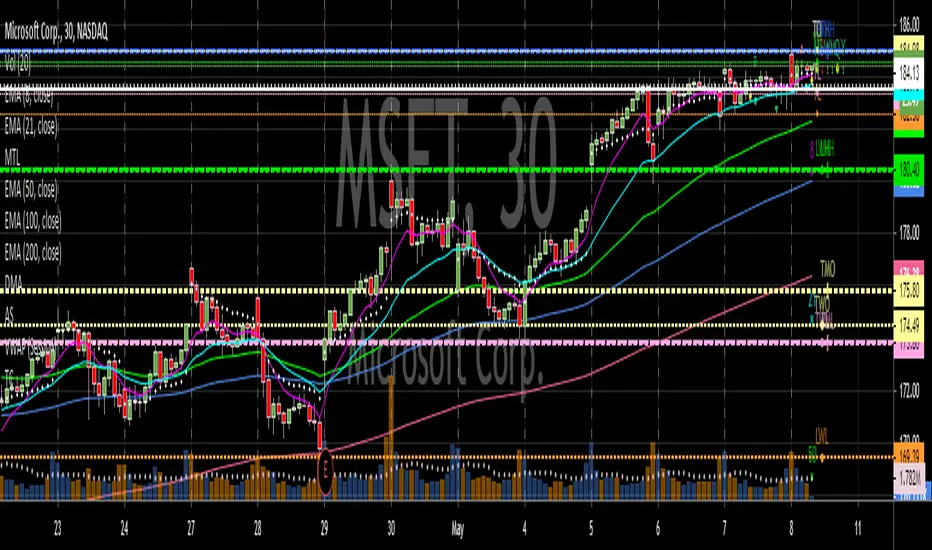
Based on Rob Smith from T3Live's "The Strat" system.
Places an indicator on the top right of the chart that shows if the current bar on the current or higher timeframe is red or green.
Allows the user to identify timeframe continuity or conflicting timeframes at a glance.
Not recommended for those who have not completed Rob's course.
Places an indicator on the top right of the chart that shows if the current bar on the current or higher timeframe is red or green.
Allows the user to identify timeframe continuity or conflicting timeframes at a glance.
Not recommended for those who have not completed Rob's course.
Catatan Rilis
Script will now draw a yellow circle behind the associated arrow if the current bar is inside.Indicator has also been moved to the bottom of the screen by default.
Catatan Rilis
Moved default location back to top.Catatan Rilis
A silver square will now display behind the associated red/green arrow if the current bar is outside.Changed location of bars to the right of the current bar to improve visibility.
This script is designed for those who view multiple symbols simultaneously and do not have the screen space to view all time frame charts at the same time.
The Strat
Catatan Rilis
No functionality changes. Corrected a naming issue in the settings menu.Skrip terproteksi
Skrip ini diterbitkan sebagai sumber tertutup. Namun, Anda dapat menggunakannya dengan bebas dan tanpa batasan apa pun – pelajari lebih lanjut di sini.
Pernyataan Penyangkalan
Informasi dan publikasi ini tidak dimaksudkan, dan bukan merupakan, saran atau rekomendasi keuangan, investasi, trading, atau jenis lainnya yang diberikan atau didukung oleh TradingView. Baca selengkapnya di Ketentuan Penggunaan.
Skrip terproteksi
Skrip ini diterbitkan sebagai sumber tertutup. Namun, Anda dapat menggunakannya dengan bebas dan tanpa batasan apa pun – pelajari lebih lanjut di sini.
Pernyataan Penyangkalan
Informasi dan publikasi ini tidak dimaksudkan, dan bukan merupakan, saran atau rekomendasi keuangan, investasi, trading, atau jenis lainnya yang diberikan atau didukung oleh TradingView. Baca selengkapnya di Ketentuan Penggunaan.