OPEN-SOURCE SCRIPT
Diupdate Composite Indicator (Donchian + OBV)
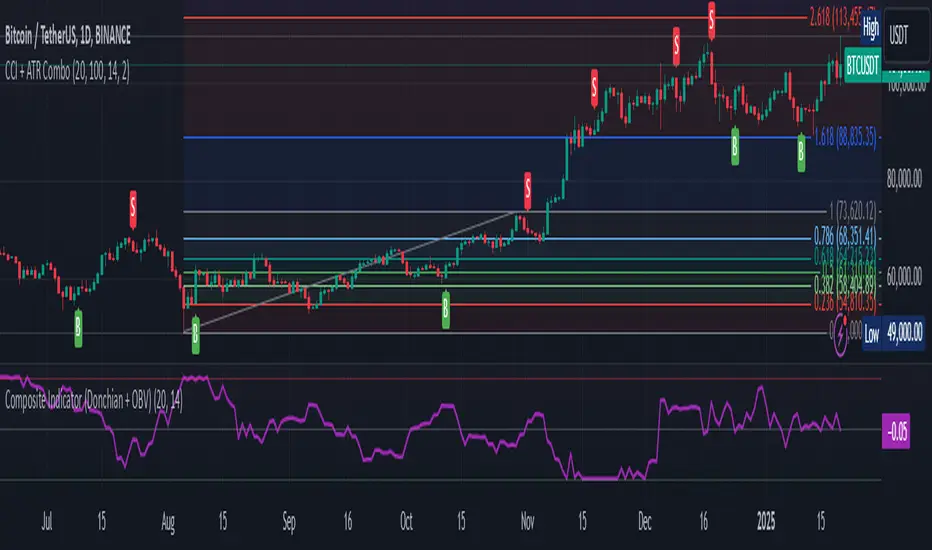
Composite Indicator (Donchian + OBV)
The Composite Indicator (Donchian + OBV) is a powerful tool designed to evaluate the strength of market breakouts and momentum trends, offering traders a comprehensive perspective on price action. This indicator combines the Donchian Channel with On-Balance Volume (OBV) to create a dynamic and easy-to-interpret metric scaled between -1 and 1.
Key Features
How It Works
How to Use
Customization Options
Ideal Use Cases
Example Applications
Limitations
Final Thoughts
The Composite Indicator (Donchian + OBV) offers traders a versatile tool to navigate complex markets. By blending breakout analysis with volume-based momentum, this indicator provides an actionable edge for identifying high-probability opportunities and potential reversals.
The Composite Indicator (Donchian + OBV) is a powerful tool designed to evaluate the strength of market breakouts and momentum trends, offering traders a comprehensive perspective on price action. This indicator combines the Donchian Channel with On-Balance Volume (OBV) to create a dynamic and easy-to-interpret metric scaled between -1 and 1.
Key Features
- Breakout Strength Analysis:
- The indicator assesses the strength of price breakouts relative to the upper and lower bounds of the Donchian Channel.
- Positive values close to 1 indicate a strong bullish breakout.
- Negative values close to -1 indicate a strong bearish breakout. - Momentum Detection with OBV:
- On-Balance Volume (OBV) tracks the cumulative buying and selling volume to gauge market momentum.
- The smoothed OBV trend ensures the momentum component aligns with price action, reducing noise. - Integrated Composite Value:
- Combines breakout strength and OBV momentum into a single metric for enhanced clarity.
- The final composite value highlights whether the market is bullish, bearish, or neutral. - Divergence Detection:
- Spot bullish divergences when the indicator rises while price falls, suggesting a potential upward reversal.
- Identify bearish divergences when the indicator falls while price rises, hinting at a potential downward reversal.
How It Works
- Donchian Channel Analysis:
- Calculates the highest high and lowest low over a user-defined period to establish the upper and lower channels.
- Breakouts beyond these channels contribute to the breakout strength component. - OBV Momentum:
- Measures cumulative volume trends to validate price movements.
- Momentum is derived from the rate of change in smoothed OBV values. - Composite Calculation:
- Combines breakout strength and OBV momentum, normalized and scaled to -1 to 1 for clarity.
How to Use
- Bullish Breakout:
- When the indicator value approaches 1, it signals a strong upward breakout supported by positive OBV momentum.
- Example Action: Consider a Buy if price breaks the upper Donchian Channel with increasing OBV. - Bearish Breakout:
- When the indicator value approaches -1, it indicates a strong downward breakout supported by negative OBV momentum.
- Example Action: Consider a Sell if price breaks the lower Donchian Channel with decreasing OBV. - Neutral Market:
- When the value is near 0, the market is likely balanced with no significant breakout or momentum detected. - Divergence Opportunities:
- Bullish Divergence: Price makes lower lows, but the indicator trends upward → Potential upward reversal.
- Bearish Divergence: Price makes higher highs, but the indicator trends downward → Potential downward reversal.
Customization Options
- Donchian Channel Length: Adjust the period for the upper and lower bounds.
- OBV Smoothing Length: Modify the smoothing period for OBV to fine-tune momentum detection.
- Scaling Adjustments: The composite value is automatically normalized for consistency across timeframes.
Ideal Use Cases
- Breakout Trading: Identify and confirm strong breakouts in volatile markets.
- Momentum Confirmation: Validate price movements with volume-based momentum.
- Reversal Detection: Leverage divergences to spot potential market reversals.
Example Applications
- Strong Bullish Signal:
- Price breaks the upper channel, and OBV shows increasing volume → Composite value near 1.
- Action: Enter a Buy position and set a Stop Loss below the upper channel. - Strong Bearish Signal:
- Price breaks the lower channel, and OBV shows decreasing volume → Composite value near -1.
- Action: Enter a Sell position and set a Stop Loss above the lower channel. - Neutral Market:
- Composite value near 0 suggests indecision or consolidation. Wait for a breakout.
Limitations
- Best used alongside additional tools like RSI or MACD for filtering noise and improving decision-making.
- Requires careful parameter tuning based on the asset and timeframe.
Final Thoughts
The Composite Indicator (Donchian + OBV) offers traders a versatile tool to navigate complex markets. By blending breakout analysis with volume-based momentum, this indicator provides an actionable edge for identifying high-probability opportunities and potential reversals.
Catatan Rilis
Key Features:- Combines Donchian Channel and OBV Momentum: Merges two popular indicators to deliver a comprehensive view of market dynamics.
- Adjustable Signal Sensitivity: Fine-tune signal strength with the "Signal Adjustment Factor" for various trading styles.
- Visual Guidance: Horizontal lines (Upper Bound, Zero Line, Lower Bound) make signal interpretation intuitive.
- Multi-Dimensional Signal: Incorporates price breakout strength and volume momentum in one plot.
- Divergence Detection: Highlights discrepancies between price action and OBV momentum, helping traders anticipate potential reversals.
How It Works:
1. The Donchian Channel calculates the highest high and lowest low over a user-defined length, highlighting breakout levels.
2. The OBV Momentum uses smoothed OBV changes to identify the directional strength of volume.
3. Both components are combined and scaled into a single composite value between -1 and 1.
4. The Signal Adjustment Factor multiplies the composite value to adjust sensitivity, helping traders align the indicator with their strategies.
5. Divergence Detection:
- A bullish divergence occurs when the price makes lower lows, but the composite value forms higher lows, indicating weakening bearish momentum.
- A bearish divergence occurs when the price makes higher highs, but the composite value forms lower highs, suggesting weakening bullish momentum.
Advantages:
- Provides a holistic view by integrating price action and volume momentum.
- Detects divergence between price and volume to anticipate potential reversals.
- Highly customizable to suit various market conditions and trading preferences.
- Scaled signal simplifies interpretation, reducing noise in volatile markets.
- Suitable for both breakout and trend-following strategies.
Suggested Parameter Settings:
- Donchian Channel Length: 20 (default) – Ideal for identifying medium-term breakouts. Adjust to higher values for longer trends.
- OBV Smoothing Length: 14 (default) – Balances responsiveness and noise reduction. Experiment with shorter lengths for more reactive signals.
- Signal Adjustment Factor: 100 (default) – Use higher values for stronger signals in low-volatility environments.
Example Use Cases:
- Breakout Confirmation: Use the composite value crossing above 0 to confirm bullish breakouts or below 0 for bearish breakouts.
- Trend Reversal Detection: Look for the signal crossing the Zero Line in the opposite direction of the prevailing trend.
- Volume-Based Filter: Combine with moving averages or RSI to validate trades by considering volume momentum.
- Divergence Identification: Monitor for bullish or bearish divergences between price and the composite signal to anticipate potential reversals.
Final Thoughts:
The Composite Indicator (Donchian + OBV) offers a robust approach to trading by combining price and volume analysis. Its flexibility, divergence detection, and intuitive visual design make it a valuable tool for traders of all experience levels. Pair it with additional indicators and backtest thoroughly to enhance your trading strategy.
Skrip open-source
Dengan semangat TradingView yang sesungguhnya, pembuat skrip ini telah menjadikannya sebagai sumber terbuka, sehingga para trader dapat meninjau dan memverifikasi fungsinya. Salut untuk penulisnya! Meskipun Anda dapat menggunakannya secara gratis, perlu diingat bahwa penerbitan ulang kode ini tunduk pada Tata Tertib kami.
Pernyataan Penyangkalan
Informasi dan publikasi ini tidak dimaksudkan, dan bukan merupakan, saran atau rekomendasi keuangan, investasi, trading, atau jenis lainnya yang diberikan atau didukung oleh TradingView. Baca selengkapnya di Ketentuan Penggunaan.