OPEN-SOURCE SCRIPT
Chart Patterns Buy Alerts (Intraday) - Bullish Patterns
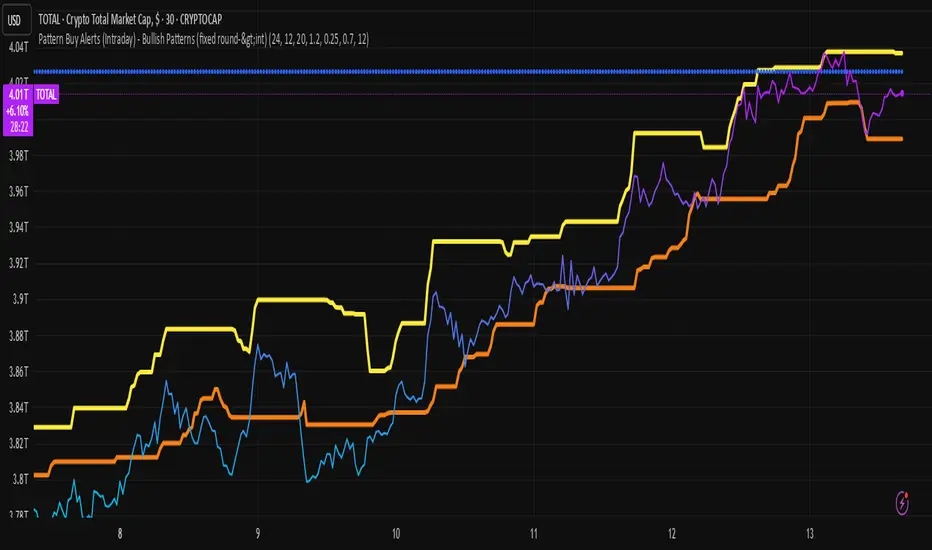
chart pattern prediction
The script plots two things:
predicted_direction → +1 (up) or -1 (down).
predicted_value → the next bar’s estimated close price.
So on your chart you’ll see:
Blue histogram → shows up (+1) or down (-1) prediction.
Orange line → predicted next value.
Interpret the Output
If the blue bar is +1, the model expects the next candle to close higher.
If the blue bar is -1, the model expects the next candle to close lower.
The orange line shows where it thinks the next close will land.
Skrip open-source
Dengan semangat TradingView yang sesungguhnya, pembuat skrip ini telah menjadikannya sebagai sumber terbuka, sehingga para trader dapat meninjau dan memverifikasi fungsinya. Salut untuk penulisnya! Meskipun Anda dapat menggunakannya secara gratis, perlu diingat bahwa penerbitan ulang kode ini tunduk pada Tata Tertib kami.
Pernyataan Penyangkalan
Informasi dan publikasi ini tidak dimaksudkan, dan bukan merupakan, saran atau rekomendasi keuangan, investasi, trading, atau jenis lainnya yang diberikan atau didukung oleh TradingView. Baca selengkapnya di Ketentuan Penggunaan.