OPEN-SOURCE SCRIPT
Relative Strength Volatility Adjusted Ema [CC]
The Relative Strength Volatility Adjusted Exponential Moving Average was created by Vitali Apirine (Stocks and Commodities Mar 2022) and this is his final indicator of his recent Relative Strength series. I published both of the previous indicators, Relative Strength Volume Adjusted Exponential Moving Average and Relative Strength Exponential Moving Average
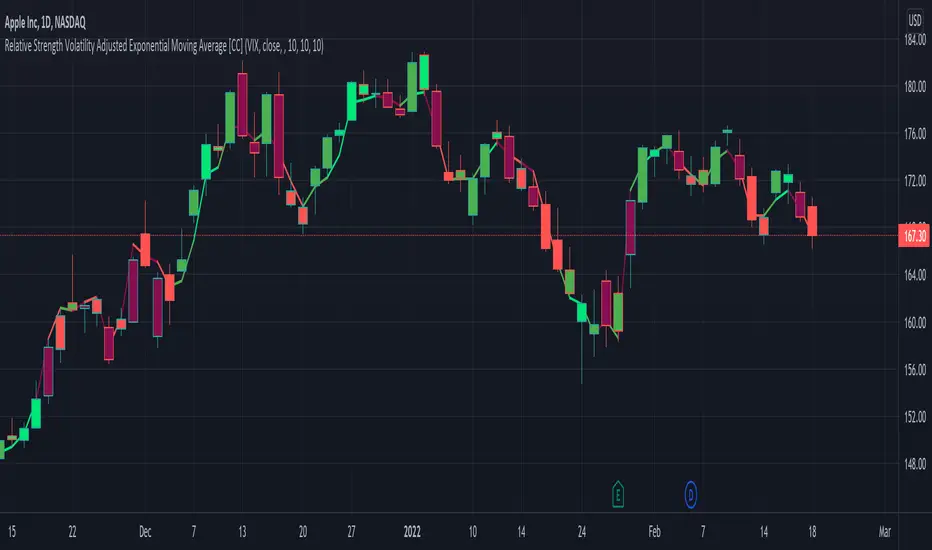
This indicator is particularly unique because it uses the Volatility Index (VIX) symbol as the default to determine volatility and uses this in place of the current stock's price into a typical relative strength calculation. As you can see in the chart, it follows the price much closer than the other two indicators and so of course this means that this indicator is best for choppy markets and the other two are better for trending markets. I would of course recommend to experiment with this one and see what works best for you.
I have included strong buy and sell signals in addition to normal ones so strong signals are darker in color and normal signals are lighter in color. Buy when the line turns green and sell when it turns red.
Let me know if there are any other indicators or scripts you would like to see me publish!
Skrip open-source
Dengan semangat TradingView yang sesungguhnya, pembuat skrip ini telah menjadikannya sebagai sumber terbuka, sehingga para trader dapat meninjau dan memverifikasi fungsinya. Salut untuk penulisnya! Meskipun Anda dapat menggunakannya secara gratis, perlu diingat bahwa penerbitan ulang kode ini tunduk pada Tata Tertib kami.
I created the largest stock indicator library:
github.com/ooples/
Custom Indicator Requests:
forms.gle/ouMffZR3dQ8bSJQG7
Tips are appreciated:
paypal.me/cheatcountry
patreon.com/cheatcountry
github.com/ooples/
Custom Indicator Requests:
forms.gle/ouMffZR3dQ8bSJQG7
Tips are appreciated:
paypal.me/cheatcountry
patreon.com/cheatcountry
Pernyataan Penyangkalan
Informasi dan publikasi ini tidak dimaksudkan, dan bukan merupakan, saran atau rekomendasi keuangan, investasi, trading, atau jenis lainnya yang diberikan atau didukung oleh TradingView. Baca selengkapnya di Ketentuan Penggunaan.