PROTECTED SOURCE SCRIPT
Diupdate Mean Reversion Entry Signal

Mean Reversion Entry Signal Indicator
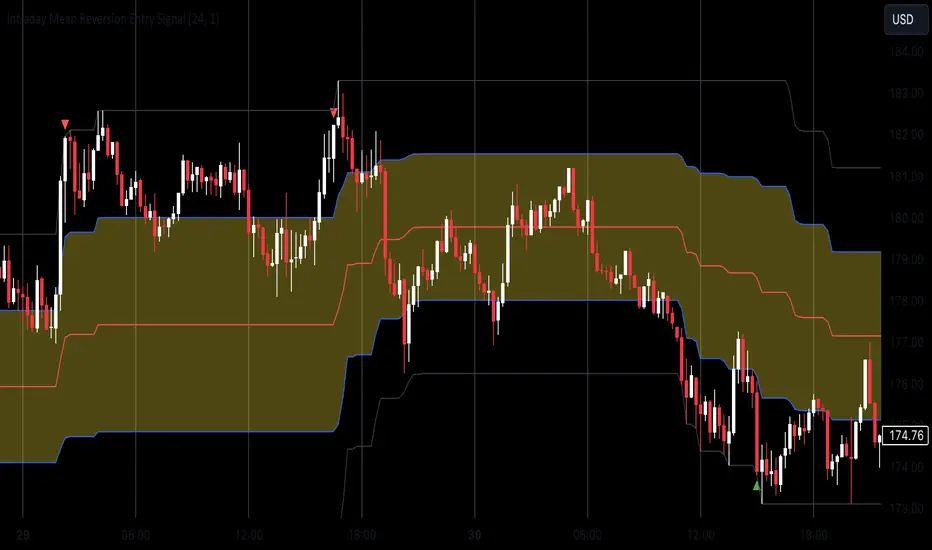
The Mean Reversion Entry Signal indicator is a trading tool designed for traders looking to capitalize on market corrections. This script leverages mean reversion principles, utilizing price levels and the Relative Strength Index (RSI) to generate potential entry signals for both long and short positions.
Key Features:
1. **Dynamic Price Levels**:
- The indicator calculates critical price levels over a user-defined lookback period, including:
- High (H)**: The highest price point over the lookback period.
- Low (L)**: The lowest price point over the lookback period.
- Midpoint (M)**: The average of the high and low.
- Midpoint High (Mh)** and **Midpoint Low (Ml)**: Additional reference levels derived from M for more nuanced trading signals.
2. User-Configurable Inputs:
- Lookback Period: Traders can specify the number of hours to look back for the calculations, allowing for tailored analysis that fits various trading strategies. By default the lookback is set for 24 hours, as i consider it the most adequate for day trading.
- Aggression Level: This input lets users choose their trading strategy's intensity, affecting the sensitivity of entry signals based on the percentage difference from the midpoint.
3. Entry Signal Generation:
The script evaluates market conditions to signal potential trades:
- Long Entries: Indicated when the price is below the Ml level and the price demonstrates a significant distance from the midpoint (M), coupled with RSI being near the oversold territory.
- Short Entries: Triggered when the price exceeds the Mh level, also indicating a significant distance from M, while the RSI indicates near overbought conditions.
4. Visual Indicators:
Clear visual signals are plotted directly on the chart:
- Long Signals are represented as upward triangles in green.
- Short Signals appear as downward triangles in red.
- Important price levels (M, H, L, Mh, and Ml) are displayed to provide traders with immediate context for potential trades.
5. No Entry Zone:
The area between Mh and Ml is shaded to indicate a "No Entry Zone," helping traders identify regions where conditions may not be favorable for taking new positions.
This can also be used as potencial profit taking area.
Conclusion
1. This indicator was built mainly for day trading, using timeframes between 1 minute and 1 hour. If you want to use it in 1D time frame, for instance, you should adjust the lookback period to 120 hours or so.
2. To use this as a strategy, you should not be afraid to "add to your losers" as the trade goes against you and the signals continue to appear.
Enjoy
Catatan Rilis
Indicated for Crypto since the signal only responds to relatively high volatilityCatatan Rilis
How the indicator worksIt determines the highest (H) and lowest (L) price levels of the lookback period establishing this as the trading range. Then it calculates the midpoint (M) and the additional levels Mh (the point between H and M) and Ml (the point between L and M). This way, it establish the top and bottom 25% of the trading range. The indicator suggests that you should only sell on the top of the range and buy on the bottom. No entries should be made on the intermediate zone (filled in the chart).
The aggression levels (1 to 3) are based on the distance of the price of the asset to the midpoint (M) of the range: the more the distance the less aggressiveness.
The indicator also incorporates the Relative Strength Index (RSI) to complement decision-making, evaluating overbought and oversold conditions.
In conclusion, an entry signal appears when 3 conditions occur: 1) the price reaches the extremes of the range; 2) the distance to de midpoint (M) is at least at 1,6% (aggressiveness level 3); and 3) the Relative Strength Index is above 65 or bellow 35.
Catatan Rilis
Change the name to clarify that it work only on intraday timeframesSkrip terproteksi
Skrip ini diterbitkan sebagai sumber tertutup. Namun, Anda dapat menggunakannya dengan bebas dan tanpa batasan apa pun – pelajari lebih lanjut di sini.
Pernyataan Penyangkalan
Informasi dan publikasi ini tidak dimaksudkan, dan bukan merupakan, saran atau rekomendasi keuangan, investasi, trading, atau jenis lainnya yang diberikan atau didukung oleh TradingView. Baca selengkapnya di Ketentuan Penggunaan.
Skrip terproteksi
Skrip ini diterbitkan sebagai sumber tertutup. Namun, Anda dapat menggunakannya dengan bebas dan tanpa batasan apa pun – pelajari lebih lanjut di sini.
Pernyataan Penyangkalan
Informasi dan publikasi ini tidak dimaksudkan, dan bukan merupakan, saran atau rekomendasi keuangan, investasi, trading, atau jenis lainnya yang diberikan atau didukung oleh TradingView. Baca selengkapnya di Ketentuan Penggunaan.