OPEN-SOURCE SCRIPT
Diupdate RSI Trigger Count (30 Days) - Both Sides
RSI Dual Trigger Counter (30 Days)
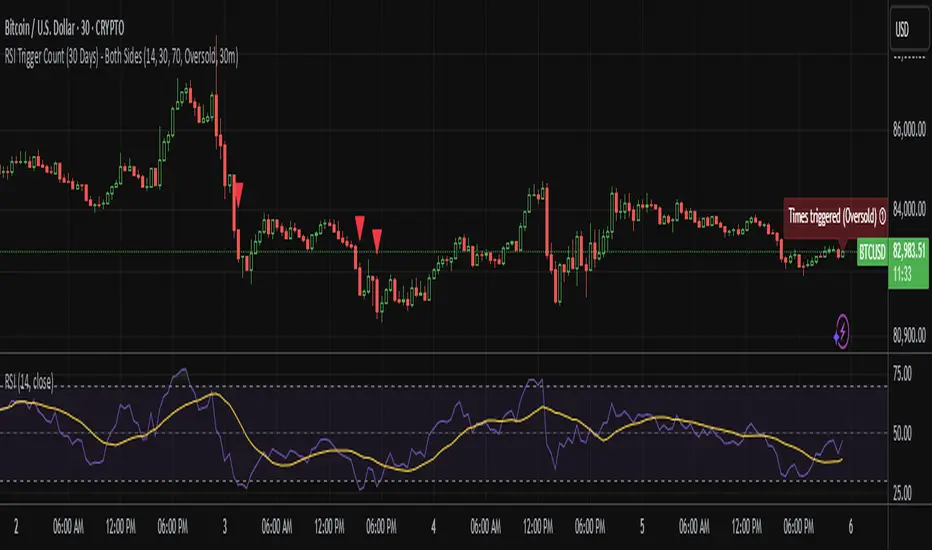
This indicator tracks both oversold (crossunder) and overbought (crossover) RSI events on a 30-minute chart, featuring:
Dual-Mode Selector:
Counts either RSI < 30 (oversold) or RSI > 70 (overbought) crossings
Toggle between modes via input menu
30-Day Rolling Count:
Displays total triggers in the last 30 days (e.g., "Times triggered (Oversold) ① 19")
Visual Alerts:
Red triangles ↓ for oversold crossunders
Green triangles ↑ for overbought crossovers
Customizable:
Adjustable RSI length (2-100) and thresholds (1-100)
Works on any timeframe (auto-scales calculations)
Purpose: Identifies frequent reversal signals for both buying dips (oversold) and selling rallies (overbought).
Catatan Rilis
Features:Tracks both oversold (RSI < 30) and overbought (RSI > 70) signals with a toggle.
30-day rolling count resets automatically.
Visual alerts (▼ red for oversold, ▲ green for overbought).
Works on all timeframes (1m to 1D+).
Use Cases:
Spot mean-reversion opportunities.
Confirm overextended price movements.
Inputs:
Adjustable RSI length, thresholds, and condition type (oversold/overbought).
Skrip open-source
Dengan semangat TradingView yang sesungguhnya, pembuat skrip ini telah menjadikannya sebagai sumber terbuka, sehingga para trader dapat meninjau dan memverifikasi fungsinya. Salut untuk penulisnya! Meskipun Anda dapat menggunakannya secara gratis, perlu diingat bahwa penerbitan ulang kode ini tunduk pada Tata Tertib kami.
Pernyataan Penyangkalan
Informasi dan publikasi ini tidak dimaksudkan, dan bukan merupakan, saran atau rekomendasi keuangan, investasi, trading, atau jenis lainnya yang diberikan atau didukung oleh TradingView. Baca selengkapnya di Ketentuan Penggunaan.