OPEN-SOURCE SCRIPT
Diupdate Stock metrics and value

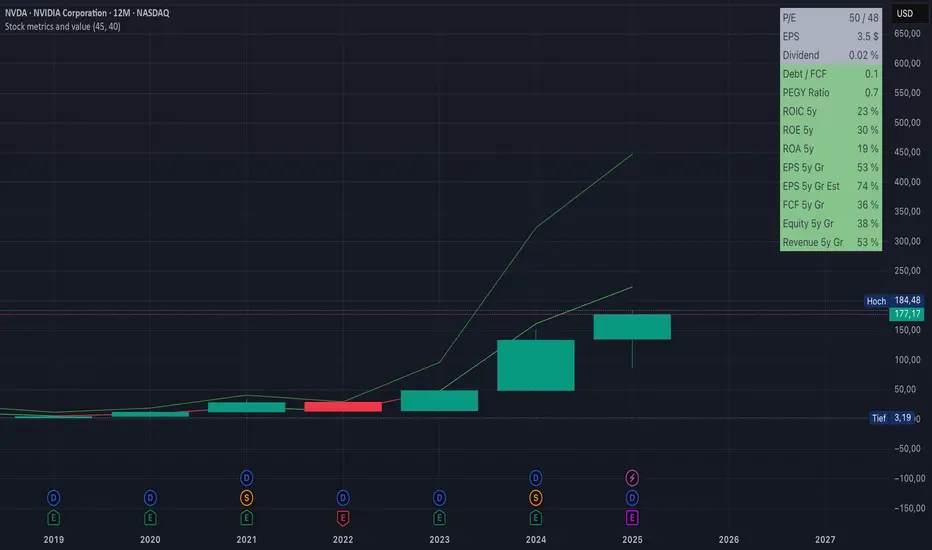
This indicator shows:
- the valuation metrics for a stock on a table on top right: PE, EPS, dividend, ROIC, ROE, ROA, EPS growth, FCF growth, Equity growth, revenue Growth
- the fair value and the value with 50% margin of safety as chart lines
The lines will be red when they are above the current price and red when they are below the current price.
The colors on the table will be red when the values are below 10% and green when they are above, that means when everything is green the metrics for the stock are good.
Catatan Rilis
Added the type "depository receipt" to be included for this indicatorCatatan Rilis
- Changed the calculation of the value to estimate only 5 years ahead with 15% yield instead of 10 years- Changed the past growth calculations to 5 years instead of 10 years
Catatan Rilis
Added Peter Lynch's PEGY ratio, P/E devided by (growth rate + dividend yield)Skrip open-source
Dengan semangat TradingView yang sesungguhnya, pembuat skrip ini telah menjadikannya sebagai sumber terbuka, sehingga para trader dapat meninjau dan memverifikasi fungsinya. Salut untuk penulisnya! Meskipun Anda dapat menggunakannya secara gratis, perlu diingat bahwa penerbitan ulang kode ini tunduk pada Tata Tertib kami.
Pernyataan Penyangkalan
Informasi dan publikasi ini tidak dimaksudkan, dan bukan merupakan, saran atau rekomendasi keuangan, investasi, trading, atau jenis lainnya yang diberikan atau didukung oleh TradingView. Baca selengkapnya di Ketentuan Penggunaan.
Skrip open-source
Dengan semangat TradingView yang sesungguhnya, pembuat skrip ini telah menjadikannya sebagai sumber terbuka, sehingga para trader dapat meninjau dan memverifikasi fungsinya. Salut untuk penulisnya! Meskipun Anda dapat menggunakannya secara gratis, perlu diingat bahwa penerbitan ulang kode ini tunduk pada Tata Tertib kami.
Pernyataan Penyangkalan
Informasi dan publikasi ini tidak dimaksudkan, dan bukan merupakan, saran atau rekomendasi keuangan, investasi, trading, atau jenis lainnya yang diberikan atau didukung oleh TradingView. Baca selengkapnya di Ketentuan Penggunaan.