OPEN-SOURCE SCRIPT
Diupdate TASC 2021.10 - Cycle/Trend Analytics
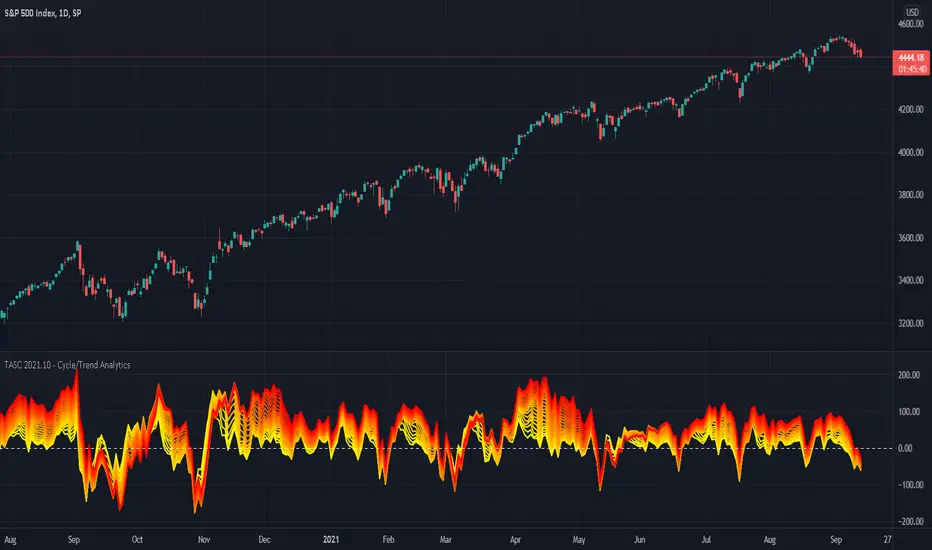
Presented here is code for the "Cycle/Trend Analytics" indicator originally conceived by John Ehlers. This is another one of TradingView's first code releases published in the October 2021 issue of Trader's Tips by Technical Analysis of Stocks & Commodities (TASC) magazine.
This indicator, referred to as "CTA" in later explanations, has a companion indicator that is discussed in the article entitled MAD Moving Average Difference, authored by John Ehlers. He's providing an innovative double dose of indicator code for the month of October 2021.
Modes of Operation
CTA has two modes defined as "trend" and "cycle". Ehlers' intention from what can be gathered from the article is to portray "the strength of the trend" in trend mode on real data. Cycle mode exhibits the response of the bank of calculations when a hypothetical sine wave is utilized as price. When cycle mode is chosen, two other lines will be displayed that are not shown in trend mode. A more detailed explanation of the indicator's technical functionality and intention can be found in the original Cycle/Trend Analytics And The MAD Indicator article, which requires a subscription.
Computational Functionality
The CTA indicator only has one adjustment in the indicator "Settings" for choice of modes. The default mode of operation is "trend". Trend mode applies raw price data to the bank of plots, while the cycle mode employs a sinusoidal oscillator set to a cycle period of 30 bars. These are passed to multiple SMAs, which are then subtracted from the original source data. The result is a fascinating display of plots embellished with vivid array of gradient color on real data or the hypothetical sine wave.
Related Information
• SMA
• color.rgb()
Join TradingView
Catatan Rilis
v2Cosmetic changes to code.
Skrip open-source
Dengan semangat TradingView yang sesungguhnya, pembuat skrip ini telah menjadikannya sebagai sumber terbuka, sehingga para trader dapat meninjau dan memverifikasi fungsinya. Salut untuk penulisnya! Meskipun Anda dapat menggunakannya secara gratis, perlu diingat bahwa penerbitan ulang kode ini tunduk pada Tata Tertib kami.
Tools and ideas for all Pine coders: tradingview.com/u/PineCoders/
TASC: traders.com/
TASC: traders.com/
Pernyataan Penyangkalan
Informasi dan publikasi ini tidak dimaksudkan, dan bukan merupakan, saran atau rekomendasi keuangan, investasi, trading, atau jenis lainnya yang diberikan atau didukung oleh TradingView. Baca selengkapnya di Ketentuan Penggunaan.