PROTECTED SOURCE SCRIPT
Trend Force Meter | JeffreyTimmermans

Trend Force Meter
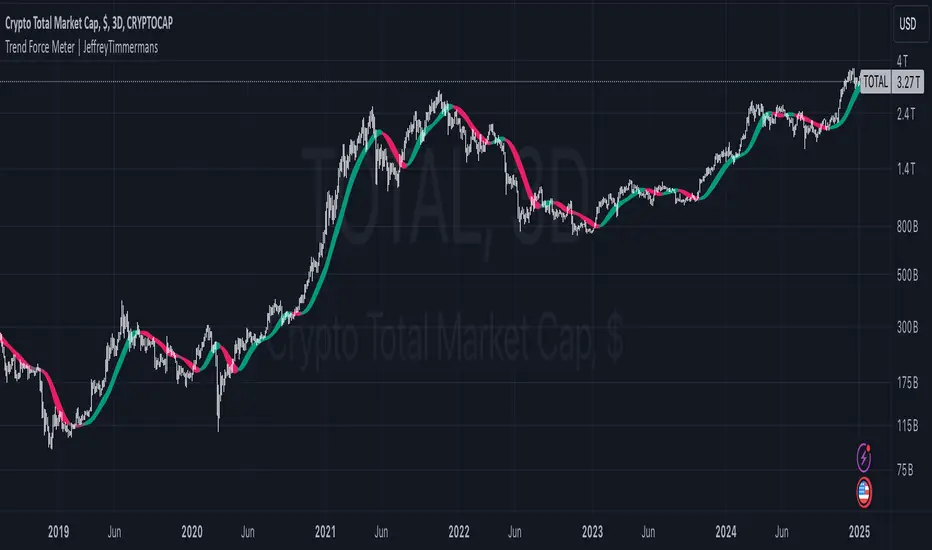
The "Trend Force Meter" is an innovative trading tool designed to visualize trend strength and provide precise signals for identifying market dynamics. By combining the Hull Moving Average (HMA) with the Simple Moving Average (SMA), it delivers a comprehensive analysis of trend forces and directions. With customizable smoothing, low-pass filtering, and an advanced color-coded display, this indicator is a valuable addition to any trader's toolkit.
Overview
The Trend Force Meter uses a unique approach to trend analysis by calculating the difference between smoothed HMA and SMA values. This difference is normalized and converted into a visually intuitive gradient to represent bullish and bearish conditions. The indicator also incorporates features for noise reduction and enhanced visualization.
Key Features
Dual Moving Averages
Customizable Smoothing
Low-Pass Filtering
Gradient-Based Visualization
Trend Strength Normalization
Alerts
Enhanced Functionality
Trend Strength Gauge
Visual Gradient
Advanced Customization
Use Cases
How It Works
Customization Options
Conclusion
The Trend Force Meter is an invaluable addition to any trader’s toolkit, combining cutting-edge techniques with intuitive visuals to make trend analysis more accessible and actionable. Its flexibility and precision cater to various trading strategies, ensuring traders stay ahead of market movements.
This script is inspired by "VanHels1ng". However, it is more advanced and includes additional features and options.
-Jeffrey
The "Trend Force Meter" is an innovative trading tool designed to visualize trend strength and provide precise signals for identifying market dynamics. By combining the Hull Moving Average (HMA) with the Simple Moving Average (SMA), it delivers a comprehensive analysis of trend forces and directions. With customizable smoothing, low-pass filtering, and an advanced color-coded display, this indicator is a valuable addition to any trader's toolkit.
Overview
The Trend Force Meter uses a unique approach to trend analysis by calculating the difference between smoothed HMA and SMA values. This difference is normalized and converted into a visually intuitive gradient to represent bullish and bearish conditions. The indicator also incorporates features for noise reduction and enhanced visualization.
Key Features
Dual Moving Averages
- Hull Moving Average (HMA): Provides a highly responsive measure of trend direction and strength.
- Simple Moving Average (SMA): Offers a stable and reliable long-term trend baseline.
Customizable Smoothing
- Enable/Disable Smoothing: Adjust the sensitivity of the HMA and SMA calculations.
- Smoothing Length: Fine-tune the smoothing parameters to match your trading style, balancing between responsiveness and stability.
Low-Pass Filtering
- Noise Reduction: Optional low-pass filter reduces market noise, providing clearer trend signals.
- Filter Length: Adjustable parameter for fine control over the noise reduction level.
Gradient-Based Visualization
- Dynamic Color Coding: Bullish trends are displayed in shades of green, while bearish trends appear in shades of red, providing immediate visual clarity.
- Strength Meter: A gradient-based strength meter quantifies the intensity of the current trend, from weak to strong.
Trend Strength Normalization
- Normalizes trend strength over a configurable period, ensuring consistent and meaningful readings across various market conditions.
Alerts
- Bullish Trend Alert: Notifies when the trend transitions to a bullish phase.
- Bearish Trend Alert: Signals when the trend turns bearish.
Enhanced Functionality
Trend Strength Gauge
- Displays a real-time strength gauge that visualizes the trend intensity, allowing traders to assess the market at a glance.
- Automatically adjusts to reflect normalized trend values, ensuring accuracy across different timeframes and volatility conditions.
Visual Gradient
- A refined gradient coloring system dynamically adjusts based on trend direction and intensity, enabling traders to easily interpret market sentiment.
Advanced Customization
- Length Settings: Fine-tune HMA and SMA lengths to match specific trading strategies.
- Smoothing Options: Toggle smoothing and low-pass filtering on or off as needed.
- Gradient Color Range: Provides flexible options for customizing the visual display.
Use Cases
- Trend Analysis: Quickly identify the direction and strength of market trends to make informed trading decisions.
- Momentum Confirmation: Use the gradient and strength meter to validate potential breakout or reversal scenarios.
- Noise Reduction: Employ the low-pass filter to focus on meaningful trends while ignoring short-term market fluctuations.
How It Works
- Calculate HMA and SMA: The indicator computes smoothed HMA and SMA values.
- Difference Extraction: The difference between the smoothed HMA and SMA forms the core trend signal.
- Optional Filtering: Low-pass filtering reduces noise, enhancing the clarity of trend signals.
- Normalization: The difference is normalized over the selected period, ensuring consistent scaling.
- Visualization: A color-coded gradient and trend strength gauge display the trend’s intensity and direction.
Customization Options
- MA Lengths: Adjust the calculation periods for HMA and SMA.
- Smoothing and Filtering: Enable or disable smoothing and filtering to refine the signal output.
- Color Palette: Choose custom colors to align with personal preferences or trading environments.
Conclusion
The Trend Force Meter is an invaluable addition to any trader’s toolkit, combining cutting-edge techniques with intuitive visuals to make trend analysis more accessible and actionable. Its flexibility and precision cater to various trading strategies, ensuring traders stay ahead of market movements.
This script is inspired by "VanHels1ng". However, it is more advanced and includes additional features and options.
-Jeffrey
Skrip terproteksi
Skrip ini diterbitkan sebagai sumber tertutup. Namun, Anda dapat menggunakannya dengan bebas dan tanpa batasan apa pun – pelajari lebih lanjut di sini.
@JeffreyTimmermans
Pernyataan Penyangkalan
Informasi dan publikasi ini tidak dimaksudkan, dan bukan merupakan, saran atau rekomendasi keuangan, investasi, trading, atau jenis lainnya yang diberikan atau didukung oleh TradingView. Baca selengkapnya di Ketentuan Penggunaan.