OPEN-SOURCE SCRIPT
Iron Condor & Butterfly Visualizer
It helps you visualize and manage your option spread by:
Plotting strike prices and breakeven lines directly on the chart.
Showing profit/loss zones, adjustment zones, and alerts when price nears critical levels.
Calculating risk/reward, probability of profit, theta decay, IV condition, and trade score.
🎯 2. Inputs & Configuration
You input your trade details as a comma-separated string:
For an Iron Condor
ShortCall, LongCall, ShortPut, LongPut, Credit, Contracts, Target%
Example: 626,628,620,618,1.20,1,30
For a Butterfly Spread
LowerWing, Body, UpperWing, Debit, Contracts, Target%
Example: 600,620,640,2.50,2,50
The indicator automatically parses this and knows which strategy type you selected.
You can also control:
Visuals (profit zones, breakevens, labels)
Risk (stop loss %, adjustment zones)
Account/risk sizing
Market conditions (IV Rank, current IV, DTE)
⚙️ 3. Data Parsing & Strategy Recognition
The code reads your pasted string, splits it by commas, and determines:
Which strikes are short vs long (or wings/body for Butterfly)
Whether the strategy is credit (Iron Condor) or debit (Butterfly)
Calculates net credit/debit, contract size, and profit target
📈 4. Profit/Loss Calculations
It dynamically calculates:
Max Profit
Iron Condor: net credit × 100 × contracts
Butterfly: (wing width − debit) × 100 × contracts
Max Loss
Iron Condor: difference between strikes minus credit
Butterfly: debit × 100 × contracts
Breakeven points
Iron Condor: short strikes ± net credit
Butterfly: body ± debit
Current P&L relative to the live price (close).
⚖️ 5. Risk & Position Sizing
It checks:
Stop-loss trigger (% of max loss)
Adjustment alert if price nears short strikes
Recommended contract size based on account size and % risk per trade
Actual % of account at risk
⏱️ 6. Time Decay & IV Analysis
If you input days to expiration, it shows:
Theta (approx daily time decay)
Decay progress bar (% of 30-day cycle)
IV condition:
Green: favorable (>50 IV Rank)
Yellow: neutral (30–50)
Red: poor (<30)
🧮 7. Trade Scoring
It gives a Trade Score (0–100) based on:
IV Rank (favorable market)
Risk/Reward ratio
Probability of profit
Default 20 baseline points
This helps gauge whether the setup is statistically attractive.
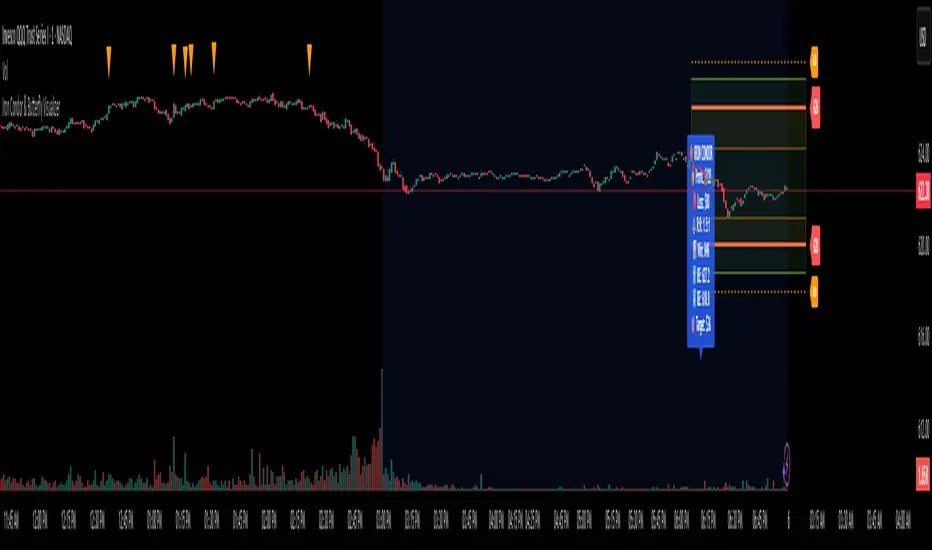
🧠 8. Visualizations
When the indicator runs, it draws on your chart:
Lines
Red = short strikes
Orange dashed = long strikes
Yellow dotted = breakeven levels
Boxes
Green = profit zone
Orange shaded = adjustment zones (approaching danger)
Labels (optional)
Strike labels (call/put prices)
Info box summarizing:
Profit, loss, risk/reward
Breakevens, theta, target, gamma risk flag
🚨 9. Alerts
The script triggers TradingView alerts when:
Price nears call or put adjustment zones
Profit target is hit
Stop loss is hit
These help you manage the trade without constant monitoring.
🧭 10. In Practice
You’d:
Copy the option strikes and trade details from your broker or analyzer.
Paste them into 📋 PASTE YOUR TRADE DATA HERE.
The indicator plots:
Profit/loss region
Adjustment warnings
Key metrics
Alerts if your trade is in danger or near target.
Plotting strike prices and breakeven lines directly on the chart.
Showing profit/loss zones, adjustment zones, and alerts when price nears critical levels.
Calculating risk/reward, probability of profit, theta decay, IV condition, and trade score.
🎯 2. Inputs & Configuration
You input your trade details as a comma-separated string:
For an Iron Condor
ShortCall, LongCall, ShortPut, LongPut, Credit, Contracts, Target%
Example: 626,628,620,618,1.20,1,30
For a Butterfly Spread
LowerWing, Body, UpperWing, Debit, Contracts, Target%
Example: 600,620,640,2.50,2,50
The indicator automatically parses this and knows which strategy type you selected.
You can also control:
Visuals (profit zones, breakevens, labels)
Risk (stop loss %, adjustment zones)
Account/risk sizing
Market conditions (IV Rank, current IV, DTE)
⚙️ 3. Data Parsing & Strategy Recognition
The code reads your pasted string, splits it by commas, and determines:
Which strikes are short vs long (or wings/body for Butterfly)
Whether the strategy is credit (Iron Condor) or debit (Butterfly)
Calculates net credit/debit, contract size, and profit target
📈 4. Profit/Loss Calculations
It dynamically calculates:
Max Profit
Iron Condor: net credit × 100 × contracts
Butterfly: (wing width − debit) × 100 × contracts
Max Loss
Iron Condor: difference between strikes minus credit
Butterfly: debit × 100 × contracts
Breakeven points
Iron Condor: short strikes ± net credit
Butterfly: body ± debit
Current P&L relative to the live price (close).
⚖️ 5. Risk & Position Sizing
It checks:
Stop-loss trigger (% of max loss)
Adjustment alert if price nears short strikes
Recommended contract size based on account size and % risk per trade
Actual % of account at risk
⏱️ 6. Time Decay & IV Analysis
If you input days to expiration, it shows:
Theta (approx daily time decay)
Decay progress bar (% of 30-day cycle)
IV condition:
Green: favorable (>50 IV Rank)
Yellow: neutral (30–50)
Red: poor (<30)
🧮 7. Trade Scoring
It gives a Trade Score (0–100) based on:
IV Rank (favorable market)
Risk/Reward ratio
Probability of profit
Default 20 baseline points
This helps gauge whether the setup is statistically attractive.
🧠 8. Visualizations
When the indicator runs, it draws on your chart:
Lines
Red = short strikes
Orange dashed = long strikes
Yellow dotted = breakeven levels
Boxes
Green = profit zone
Orange shaded = adjustment zones (approaching danger)
Labels (optional)
Strike labels (call/put prices)
Info box summarizing:
Profit, loss, risk/reward
Breakevens, theta, target, gamma risk flag
🚨 9. Alerts
The script triggers TradingView alerts when:
Price nears call or put adjustment zones
Profit target is hit
Stop loss is hit
These help you manage the trade without constant monitoring.
🧭 10. In Practice
You’d:
Copy the option strikes and trade details from your broker or analyzer.
Paste them into 📋 PASTE YOUR TRADE DATA HERE.
The indicator plots:
Profit/loss region
Adjustment warnings
Key metrics
Alerts if your trade is in danger or near target.
Skrip open-source
Dengan semangat TradingView yang sesungguhnya, pembuat skrip ini telah menjadikannya sebagai sumber terbuka, sehingga para trader dapat meninjau dan memverifikasi fungsinya. Salut untuk penulisnya! Meskipun Anda dapat menggunakannya secara gratis, perlu diingat bahwa penerbitan ulang kode ini tunduk pada Tata Tertib kami.
Pernyataan Penyangkalan
Informasi dan publikasi ini tidak dimaksudkan, dan bukan merupakan, saran atau rekomendasi keuangan, investasi, trading, atau jenis lainnya yang diberikan atau didukung oleh TradingView. Baca selengkapnya di Ketentuan Penggunaan.