OPEN-SOURCE SCRIPT
Hull MA Multi-Time Frame 30 minutes
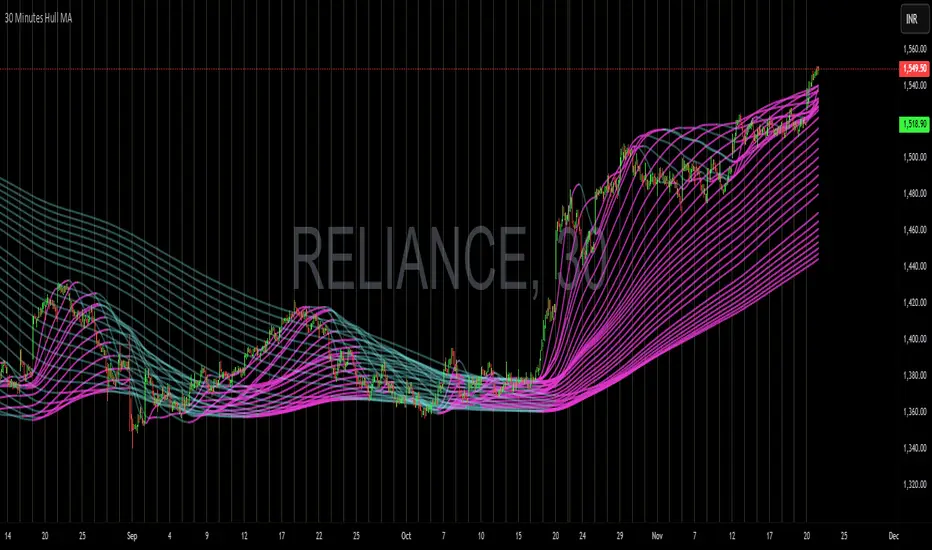
A Hull Moving Average (HMA) plotted on a fixed 30-minute timeframe gives a smooth, lag-free trend indication by filtering out noise.
When multiple HMAs of varying lengths converge near the lower side, it signals bullish accumulation, suggesting that sellers are exhausted and buyers are stepping in.
Conversely, when HMAs form a bouquet or cluster near the top, it indicates distribution or weakening momentum, signaling a potential bearish reversal.
In essence, HMA alignment and convergence act as a visual gauge of trend strength and turning points in market sentiment.
Skrip open-source
In true TradingView spirit, the creator of this script has made it open-source, so that traders can review and verify its functionality. Kudos to the author! While you can use it for free, remember that republishing the code is subject to our House Rules.
Pernyataan Penyangkalan
The information and publications are not meant to be, and do not constitute, financial, investment, trading, or other types of advice or recommendations supplied or endorsed by TradingView. Read more in the Terms of Use.