OPEN-SOURCE SCRIPT
Trend Intensity
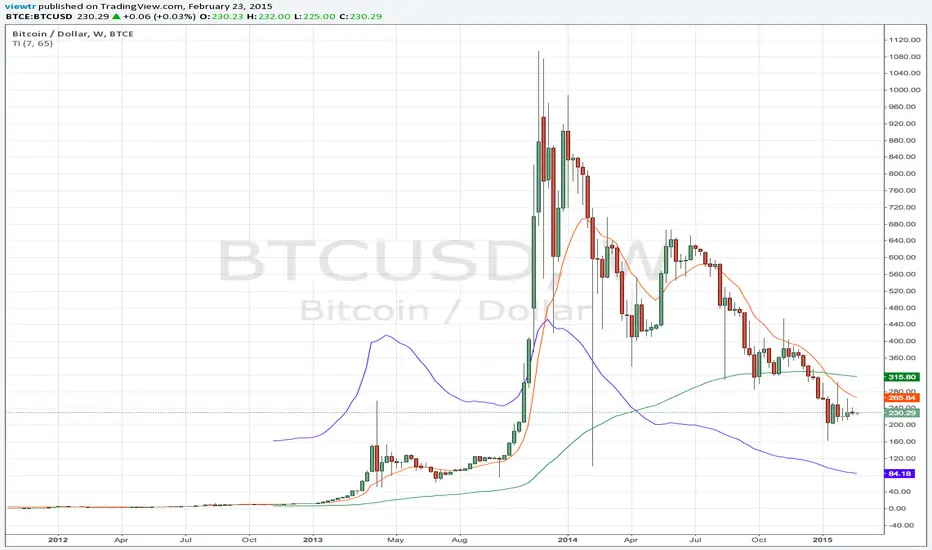
The Trend Intensity indicator measures the strength of the trend. Trend intensity tells us whether we are in an up or downtrend.
Ex:
A TI value of 150 means that the 7 day moving average is currently 50% above the 65 day moving average. This tells us that prices were moving up quickly in recent history.
A TI value of 80 tells us that the 7 day moving average is currently 20% below the 65 day moving average. This tells us that prices were moving down in recent history.
Skrip open-source
Dengan semangat TradingView yang sesungguhnya, pembuat skrip ini telah menjadikannya sebagai sumber terbuka, sehingga para trader dapat meninjau dan memverifikasi fungsinya. Salut untuk penulisnya! Meskipun Anda dapat menggunakannya secara gratis, perlu diingat bahwa penerbitan ulang kode ini tunduk pada Tata Tertib kami.
Pernyataan Penyangkalan
Informasi dan publikasi ini tidak dimaksudkan, dan bukan merupakan, saran atau rekomendasi keuangan, investasi, trading, atau jenis lainnya yang diberikan atau didukung oleh TradingView. Baca selengkapnya di Ketentuan Penggunaan.