OPEN-SOURCE SCRIPT
Pure Coca
Pure Coca - Trend & Mean Reversion Indicator
Overview
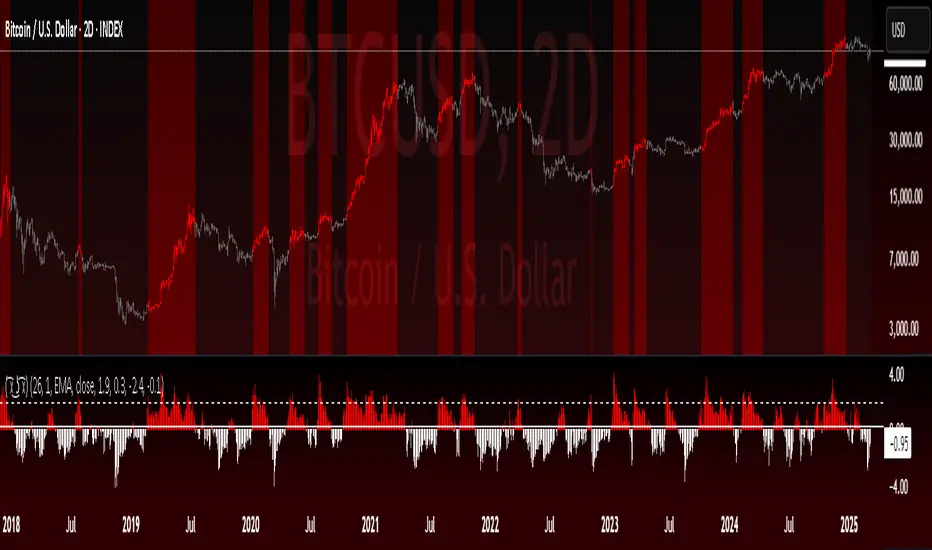
The Pure Coca indicator is a trend and mean reversion analysis tool designed for identifying dynamic shifts in market behavior. By leveraging Z-score calculations, this indicator captures both trend-following and mean-reverting periods, making it useful for a wide range of trading strategies.
What It Does
📉 Detects Overbought & Oversold Conditions using a Z-score framework.
🎯 Identifies Trend vs. Mean Reversion Phases by analyzing the deviation of price from its historical average.
📊 Customizable Moving Averages (EMA, SMA, VWMA, etc.) for smoothing Z-score calculations.
🔄 Adaptable to Any Timeframe – Default settings are optimized for 2D charts but can be adjusted to suit different market conditions.
How It Works
Computes a Z-score of price movements, normalized over a lookback period.
Plots upper and lower boundaries to visualize extreme price movements.
Dynamic Midlines adjust entry and exit conditions based on market shifts.
Background & Bar Coloring help traders quickly identify trading opportunities.
Key Features & Inputs
✔ Lookback Period: Adjustable period for calculating Z-score.
✔ Custom MA Smoothing: Choose from EMA, SMA, WMA, VWAP, and more.
✔ Z-Score Thresholds: Set upper and lower bounds to define overbought/oversold conditions.
✔ Trend vs. Mean Reversion Mode: Enables traders to spot momentum shifts in real-time.
✔ Bar Coloring & Background Highlights: Enhances visual clarity for decision-making.
How to Use It
Trend Trading: Enter when the Z-score crosses key levels (upper/lower boundary).
Mean Reversion: Look for reversals when price returns to the midline.
Custom Optimization: Adjust lookback periods and MA types based on market conditions.
Why It's Unique
✅ Combines Trend & Mean Reversion Analysis in one indicator.
✅ Flexible Z-score settings & MA choices for enhanced adaptability.
✅ Clear visual representation of market extremes.
Final Notes
This indicator is best suited for discretionary traders, quantitative analysts, and systematic traders looking for data-driven market insights. As with any trading tool, use in conjunction with other analysis methods for optimal results.
Overview
The Pure Coca indicator is a trend and mean reversion analysis tool designed for identifying dynamic shifts in market behavior. By leveraging Z-score calculations, this indicator captures both trend-following and mean-reverting periods, making it useful for a wide range of trading strategies.
What It Does
📉 Detects Overbought & Oversold Conditions using a Z-score framework.
🎯 Identifies Trend vs. Mean Reversion Phases by analyzing the deviation of price from its historical average.
📊 Customizable Moving Averages (EMA, SMA, VWMA, etc.) for smoothing Z-score calculations.
🔄 Adaptable to Any Timeframe – Default settings are optimized for 2D charts but can be adjusted to suit different market conditions.
How It Works
Computes a Z-score of price movements, normalized over a lookback period.
Plots upper and lower boundaries to visualize extreme price movements.
Dynamic Midlines adjust entry and exit conditions based on market shifts.
Background & Bar Coloring help traders quickly identify trading opportunities.
Key Features & Inputs
✔ Lookback Period: Adjustable period for calculating Z-score.
✔ Custom MA Smoothing: Choose from EMA, SMA, WMA, VWAP, and more.
✔ Z-Score Thresholds: Set upper and lower bounds to define overbought/oversold conditions.
✔ Trend vs. Mean Reversion Mode: Enables traders to spot momentum shifts in real-time.
✔ Bar Coloring & Background Highlights: Enhances visual clarity for decision-making.
How to Use It
Trend Trading: Enter when the Z-score crosses key levels (upper/lower boundary).
Mean Reversion: Look for reversals when price returns to the midline.
Custom Optimization: Adjust lookback periods and MA types based on market conditions.
Why It's Unique
✅ Combines Trend & Mean Reversion Analysis in one indicator.
✅ Flexible Z-score settings & MA choices for enhanced adaptability.
✅ Clear visual representation of market extremes.
Final Notes
This indicator is best suited for discretionary traders, quantitative analysts, and systematic traders looking for data-driven market insights. As with any trading tool, use in conjunction with other analysis methods for optimal results.
Skrip open-source
Dengan semangat TradingView yang sesungguhnya, pembuat skrip ini telah menjadikannya sebagai sumber terbuka, sehingga para trader dapat meninjau dan memverifikasi fungsinya. Salut untuk penulisnya! Meskipun Anda dapat menggunakannya secara gratis, perlu diingat bahwa penerbitan ulang kode ini tunduk pada Tata Tertib kami.
Pernyataan Penyangkalan
Informasi dan publikasi ini tidak dimaksudkan, dan bukan merupakan, saran atau rekomendasi keuangan, investasi, trading, atau jenis lainnya yang diberikan atau didukung oleh TradingView. Baca selengkapnya di Ketentuan Penggunaan.