PROTECTED SOURCE SCRIPT
Diupdate UDI Directional Lines 5/20ema
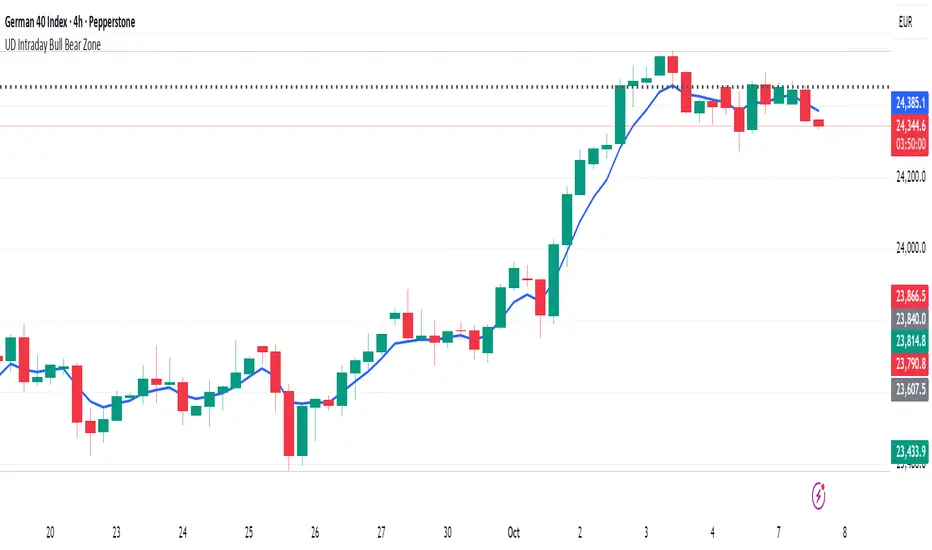
This indicator indicates the use of ema lines to determine the change of directions where:
- 5ema black line indicates small trend shift
- 20ema red line indicates big trend shift
On top of it the circles below the chart shows the momentum to execute where
- green indicates bull trend and cycle
- red indicates red trend and cycle
With the combination of direction and momentum there will be more accuracy in tracking the trend movement of a particular asset
Catatan Rilis
The blue line is the line that indicates the bull bear zone of the intraday movement where candle closing above is entering Bull and Below is entering BearSkrip terproteksi
Skrip ini diterbitkan sebagai sumber tertutup. Namun, Anda dapat menggunakannya dengan bebas dan tanpa batasan apa pun – pelajari lebih lanjut di sini.
Ups and Downs by Entreuverse
Pernyataan Penyangkalan
Informasi dan publikasi ini tidak dimaksudkan, dan bukan merupakan, saran atau rekomendasi keuangan, investasi, trading, atau jenis lainnya yang diberikan atau didukung oleh TradingView. Baca selengkapnya di Ketentuan Penggunaan.
Skrip terproteksi
Skrip ini diterbitkan sebagai sumber tertutup. Namun, Anda dapat menggunakannya dengan bebas dan tanpa batasan apa pun – pelajari lebih lanjut di sini.
Ups and Downs by Entreuverse
Pernyataan Penyangkalan
Informasi dan publikasi ini tidak dimaksudkan, dan bukan merupakan, saran atau rekomendasi keuangan, investasi, trading, atau jenis lainnya yang diberikan atau didukung oleh TradingView. Baca selengkapnya di Ketentuan Penggunaan.