OPEN-SOURCE SCRIPT
Straddle Indicator - Padding Guide

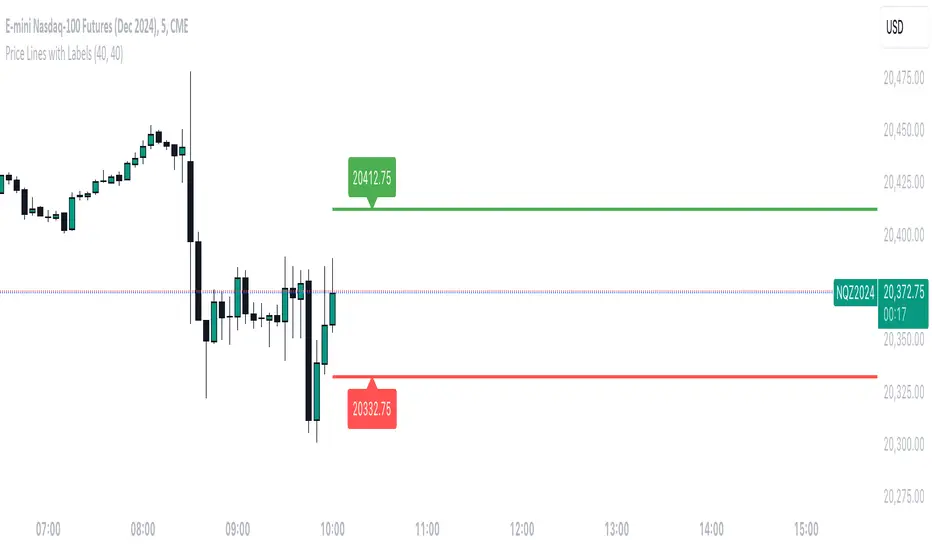
The Straddle Indicator is designed to help traders visualize potential market movements by straddling the current price. This indicator draws two horizontal lines on the chart: one positioned above and one below the current price, based on user-defined offsets.
Key Features:
Dynamic Price Levels: The levels are calculated based on the current closing price, allowing the indicator to adapt to changing market conditions in real time.
Customizable Offsets: Traders can customize the offsets for the lines above and below the current price, providing flexibility to align with their trading strategies or market analysis.
Visual Clarity: The indicator displays the price levels as horizontal lines in distinct colors (green for above and red for below) along with corresponding labels showing the exact price levels, facilitating quick reference.
Current Bar Focus: The lines and labels are updated to only reflect the current bar, minimizing chart clutter and making it easy to focus on the most relevant price action.
This indicator is particularly useful for traders employing straddle strategies, as it helps to anticipate potential price movements and plan entries or exits accordingly.
Skrip open-source
Dengan semangat TradingView yang sesungguhnya, pembuat skrip ini telah menjadikannya sebagai sumber terbuka, sehingga para trader dapat meninjau dan memverifikasi fungsinya. Salut untuk penulisnya! Meskipun Anda dapat menggunakannya secara gratis, perlu diingat bahwa penerbitan ulang kode ini tunduk pada Tata Tertib kami.
Pernyataan Penyangkalan
Informasi dan publikasi ini tidak dimaksudkan, dan bukan merupakan, saran atau rekomendasi keuangan, investasi, trading, atau jenis lainnya yang diberikan atau didukung oleh TradingView. Baca selengkapnya di Ketentuan Penggunaan.