PROTECTED SOURCE SCRIPT
Scott’s ATR volatility histogram with smoothing
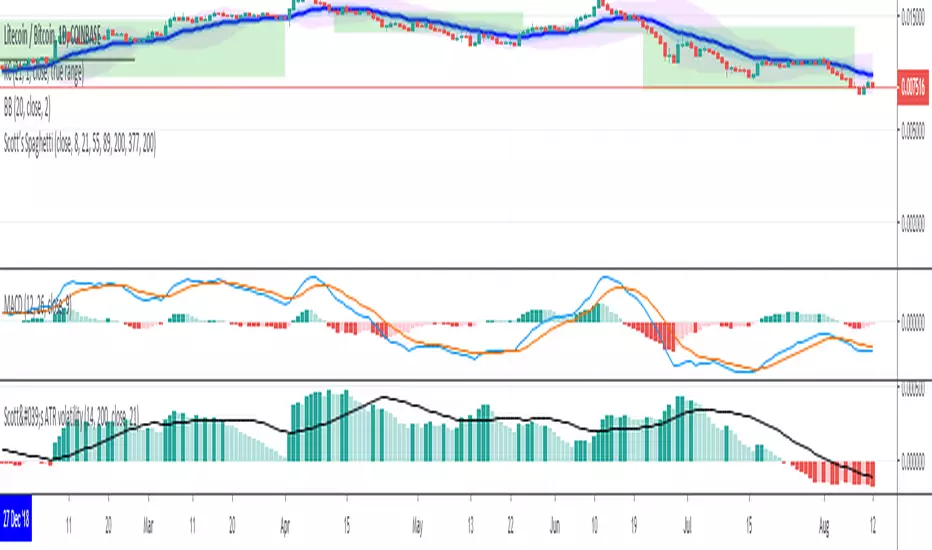
ATR shows volatility. The sma of the ATR gives a base line for whether volatility is increasing or decreasing. When ATR passes below the sma, the histogram goes red and shows that volatility is lower than the average volatilty over the last 200 (default) periods. The sma represents the zero line. I have added a 'smoothing' sma to the histogram values because it will help as a trade entry filter.... "Is the current volatility expansion (or contraction) momentum increasing or decreasing at this time" When the histogram value is above the smoothing line, volatility expansion momentum is increasing: a confirmation that the buy signal (derived from another indicator) is valid. Volatility expansion momentum also serves as a valid short entry confirmation. Volatility contraction momentum conversely tells one that a trend is not developing.
Skrip terproteksi
Skrip ini diterbitkan sebagai sumber tertutup. Namun, Anda dapat menggunakannya dengan bebas dan tanpa batasan apa pun – pelajari lebih lanjut di sini.
Pernyataan Penyangkalan
Informasi dan publikasi ini tidak dimaksudkan, dan bukan merupakan, saran atau rekomendasi keuangan, investasi, trading, atau jenis lainnya yang diberikan atau didukung oleh TradingView. Baca selengkapnya di Ketentuan Penggunaan.