PROTECTED SOURCE SCRIPT
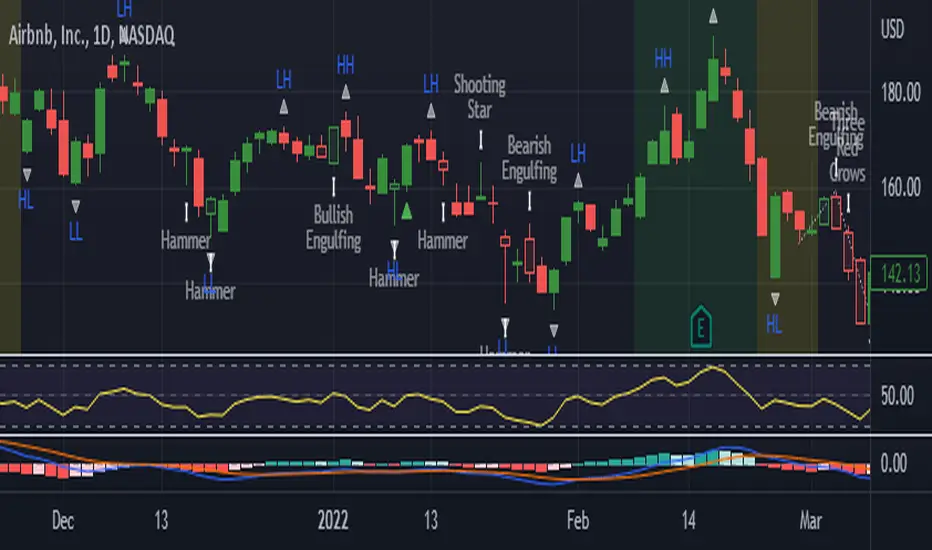
Diupdate CCI+MACD+VWAP+Breakout

Design for LONG and Day Trade only
- Identify buy and sell signal using CCI
- Green Zone when
-- Price over VWAP
-- EMA9 > EMA50 > EMA200
-- MACD fast > MACD slow
- Yellow Zone when either one failed
- White line occurs when breakout of Higher High + Higher Low
- Identify buy and sell signal using CCI
- Green Zone when
-- Price over VWAP
-- EMA9 > EMA50 > EMA200
-- MACD fast > MACD slow
- Yellow Zone when either one failed
- White line occurs when breakout of Higher High + Higher Low
Catatan Rilis
Design for LONG and Day Trade only- Identify buy and sell signal using CCI
- Green Zone when
-- Price over VWAP
-- EMA9 > EMA50 > EMA200
-- MACD fast > MACD slow
- Yellow Zone when either one failed
- White line occurs when breakout of Higher High + Higher Low
Catatan Rilis
**** Design for Day Trade Only ****New Revision [2022-07-25]
- Show Breakout Signal (green triangle) after a higherhigh and a lowerhigh occur and volatility decreasing
- Show Candle Pattern Analysis with [on / off]
- Show the trendline with [on / off]
- Show HH, LH, LL, LH with [on / off]
- Yellow Zone (backgrand) when Moving average fast line crossover slow line
- Green Zone (backgrand) when Moving average fast line crossover slow line and MACD crossover and RSI <= 80
Skrip terproteksi
Skrip ini diterbitkan sebagai sumber tertutup. Namun, Anda dapat menggunakannya dengan bebas dan tanpa batasan apa pun – pelajari lebih lanjut di sini.
Pernyataan Penyangkalan
Informasi dan publikasi ini tidak dimaksudkan, dan bukan merupakan, saran atau rekomendasi keuangan, investasi, trading, atau jenis lainnya yang diberikan atau didukung oleh TradingView. Baca selengkapnya di Ketentuan Penggunaan.