OPEN-SOURCE SCRIPT
Previous Day Levels
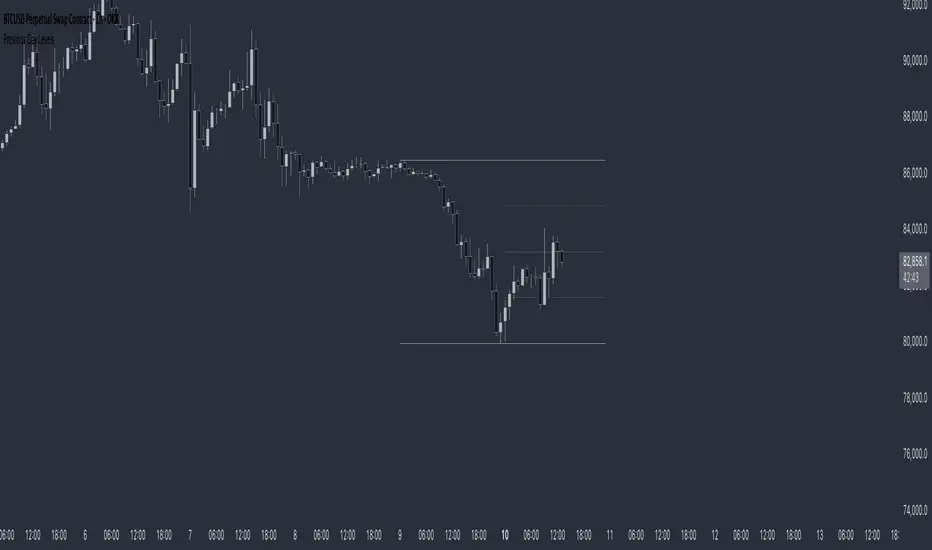
This indicator plots the previous day's high, low, and 50% levels, providing a framework for analyzing price behavior relative to these key levels.
Full Description:
The Previous Day Levels indicator is a tool designed to help traders analyze price action based on key levels from the previous trading session. By plotting the high, low, and mid-point (50%) of the prior day’s range, traders can assess potential market bias and directional tendencies for the current trading day.
Key Features:
Plots the previous day’s high (100%), low (0%), and intermediate levels (25%, 50%, 75%).
Allows users to customize line visibility, color, style, and width.
Helps traders identify potential support and resistance zones.
Provides a bias framework for determining whether price is more likely to target the previous high or low based on behavior around the 50% level.
Use Case:
This indicator is particularly useful for intraday and short-term traders who incorporate price action into their strategy.
If price trades above the 50% level and holds, it suggests a bullish bias, indicating that price may aim for the previous day's high.
If price trades below the 50% level and holds, it suggests a bearish bias, indicating that price may aim for the previous day's low.
The high and low levels can act as key support and resistance zones, where price may react or reverse.
How to Use:
Apply the indicator to your chart.
Observe how price interacts with the 50% level.
Use price behavior around these levels to establish a directional bias.
Adjust the line styles and colors to match your personal preference.
Disclaimer:
This indicator is a tool for market analysis and does not provide financial advice. Always perform your own analysis and risk management when trading.
Skrip open-source
Dengan semangat TradingView yang sesungguhnya, pembuat skrip ini telah menjadikannya sebagai sumber terbuka, sehingga para trader dapat meninjau dan memverifikasi fungsinya. Salut untuk penulisnya! Meskipun Anda dapat menggunakannya secara gratis, perlu diingat bahwa penerbitan ulang kode ini tunduk pada Tata Tertib kami.
Pernyataan Penyangkalan
Informasi dan publikasi ini tidak dimaksudkan, dan bukan merupakan, saran atau rekomendasi keuangan, investasi, trading, atau jenis lainnya yang diberikan atau didukung oleh TradingView. Baca selengkapnya di Ketentuan Penggunaan.