OPEN-SOURCE SCRIPT
Speculative Growth Map (FOR BITCOIN)
With the ever-increasing volatility flooding the cryptocurrency markets how do you ever know which side of the coin do you lie on in your investments?
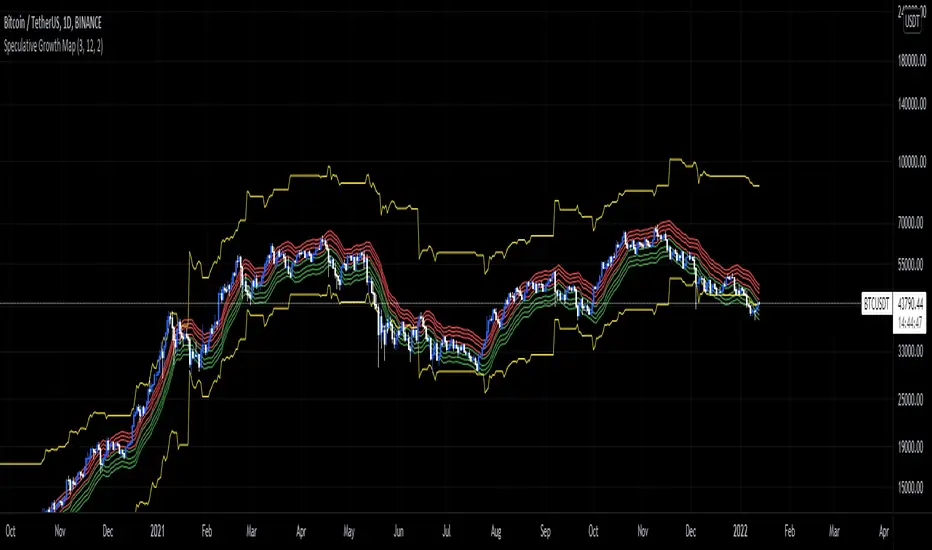
The Speculative Growth Map, SGM, aims to show investors whether they are buying into the hype or actually getting a good deal on their purchase. This indicator works by working out the growth of the asset divided into eight major sections and two extreme scenarios. The first four lines, indicated by red. show that if the market enters into that area you should not be purchasing any more assets for that market as the market has entered into optimized growth. The next four lines, in green, indicate that you should be looking into purchasing the asset as it has entered a dip or a pullback. Next up, the yellow lines, indicate an extreme growth or extreme pullbacks. If the market comes close to either of these, it indicates major price action is about to occur.
How does it actually work?
It's pretty simple.
The SGM indicator works by creating EMAs of the close multiplied by 1%, 5%, 7.5%, and 10% growths for the hodl region in red. Vice Versa, EMAs of -1%, -5%, -7.5%, and -10% growth to indicate it's time to buy the asset. The yellow lines essentially mark out the bottom and the tops whenever the price goes below and above the buy and hodl region and then separates them into two but similar lines for the top and the bottom.
Skrip open-source
In true TradingView spirit, the creator of this script has made it open-source, so that traders can review and verify its functionality. Kudos to the author! While you can use it for free, remember that republishing the code is subject to our House Rules.
Pernyataan Penyangkalan
The information and publications are not meant to be, and do not constitute, financial, investment, trading, or other types of advice or recommendations supplied or endorsed by TradingView. Read more in the Terms of Use.