OPEN-SOURCE SCRIPT
MACD Histogram/Area
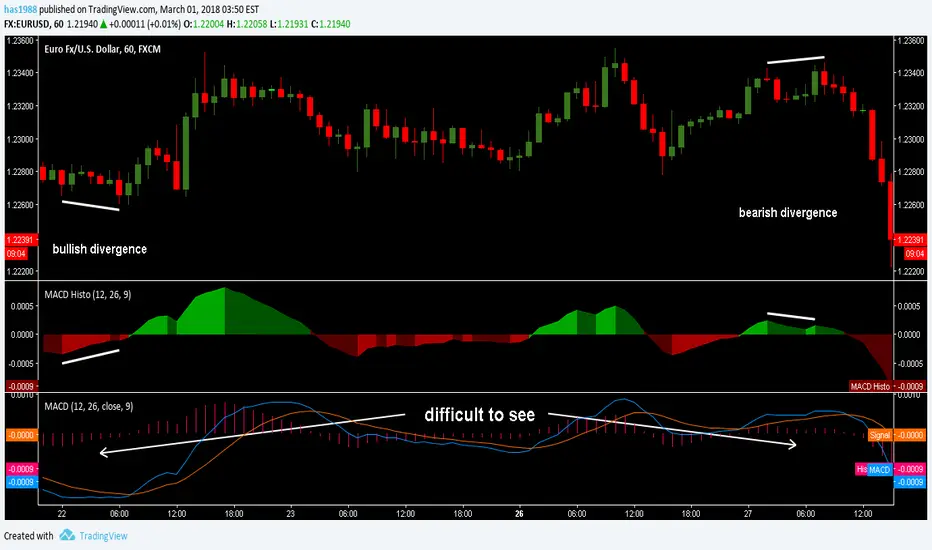
It´s just the histogram of the MACD. (Actually it´s not a histogram, I like the Area visualisation more. But you can switch.)
When I´m using the MACD, I´m just searching for a divergence between Price and the MACD-histogram. I´m not interested in the MACD-signalline or the MACD-line in any way. As you can see, The omission of them leads to better visualisation. It´s much easier to spot a divergence. On the one hand because that way the histogram scales bigger, on the other hand becauce the lines can´t overdraw the histogram.
Rules bullish Divergence: Price makes a lower low, oscillator makes higher low.
Rules bearish Divergence: Price makes a higher high, oscillator makes lower high.
Skrip open-source
Dengan semangat TradingView yang sesungguhnya, pembuat skrip ini telah menjadikannya sebagai sumber terbuka, sehingga para trader dapat meninjau dan memverifikasi fungsinya. Salut untuk penulisnya! Meskipun Anda dapat menggunakannya secara gratis, perlu diingat bahwa penerbitan ulang kode ini tunduk pada Tata Tertib kami.
Pernyataan Penyangkalan
Informasi dan publikasi ini tidak dimaksudkan, dan bukan merupakan, saran atau rekomendasi keuangan, investasi, trading, atau jenis lainnya yang diberikan atau didukung oleh TradingView. Baca selengkapnya di Ketentuan Penggunaan.