OPEN-SOURCE SCRIPT
Diupdate Moving Average Shift [Quantora]
Title: Moving Average Shift [Quantora]
Description:
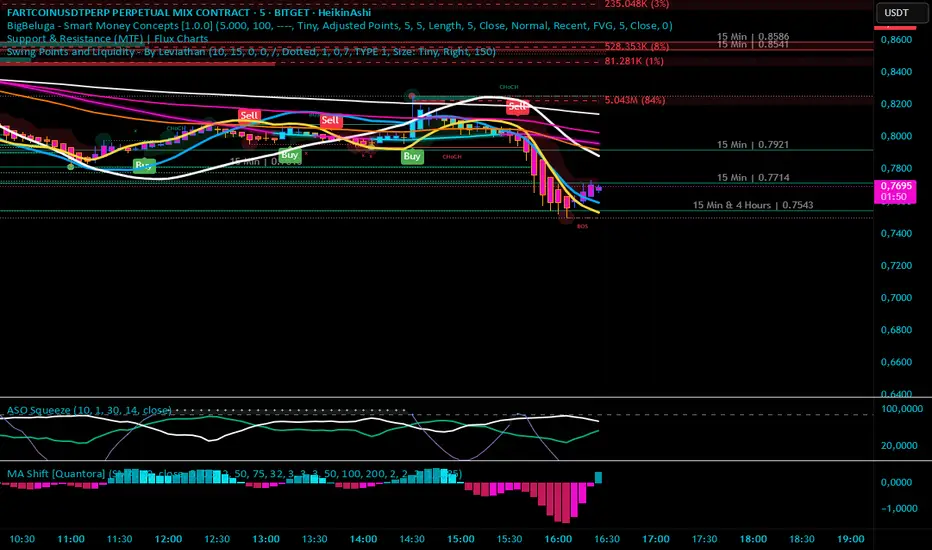
The Moving Average Shift [Quantora] is a dynamic technical analysis tool designed to help traders better visualize trend strength and direction using a combination of customizable moving averages and a volatility-adjusted oscillator.
🔧 Features:
Multi-Type Moving Average Selection
Choose from SMA, EMA, SMMA (RMA), WMA, and VWMA for your main signal line.
ZLSMA Trio
Three Zero-Lag Smoothed Moving Averages (ZLSMA) with adjustable lengths and colors provide a smoother trend-following structure without the delay of traditional MAs.
EMA Ribbon (50/100/200)
Add clarity to long-term trend direction with layered Exponential Moving Averages in key institutional periods.
Volatility-Adjusted Oscillator
A color-changing oscillator calculated from the normalized deviation between price and the selected MA. This helps identify trend shifts and momentum buildups.
Custom MA Line Widths and Styling
Full control over the width and appearance of all MA lines for visual clarity.
Bar & Candle Coloring
Bars and candles dynamically change color based on the relationship between price and the selected MA — helping you quickly assess bullish/bearish conditions.
📈 How It Helps:
Spot early trend shifts through the oscillator.
Confirm trades using the alignment between ZLSMAs and EMAs.
Quickly assess current trend conditions using color-coded price bars.
Description:
The Moving Average Shift [Quantora] is a dynamic technical analysis tool designed to help traders better visualize trend strength and direction using a combination of customizable moving averages and a volatility-adjusted oscillator.
🔧 Features:
Multi-Type Moving Average Selection
Choose from SMA, EMA, SMMA (RMA), WMA, and VWMA for your main signal line.
ZLSMA Trio
Three Zero-Lag Smoothed Moving Averages (ZLSMA) with adjustable lengths and colors provide a smoother trend-following structure without the delay of traditional MAs.
EMA Ribbon (50/100/200)
Add clarity to long-term trend direction with layered Exponential Moving Averages in key institutional periods.
Volatility-Adjusted Oscillator
A color-changing oscillator calculated from the normalized deviation between price and the selected MA. This helps identify trend shifts and momentum buildups.
Custom MA Line Widths and Styling
Full control over the width and appearance of all MA lines for visual clarity.
Bar & Candle Coloring
Bars and candles dynamically change color based on the relationship between price and the selected MA — helping you quickly assess bullish/bearish conditions.
📈 How It Helps:
Spot early trend shifts through the oscillator.
Confirm trades using the alignment between ZLSMAs and EMAs.
Quickly assess current trend conditions using color-coded price bars.
Catatan Rilis
Description:The Moving Average Shift [Quantora] is a dynamic technical analysis tool designed to help traders better visualize trend strength and direction using a combination of customizable moving averages and a volatility-adjusted oscillator.
🔧 Features:
Multi-Type Moving Average Selection
Choose from SMA, EMA, SMMA (RMA), WMA, and VWMA for your main signal line.
ZLSMA Trio
Three Zero-Lag Smoothed Moving Averages (ZLSMA) with adjustable lengths and colors provide a smoother trend-following structure without the delay of traditional MAs.
EMA Ribbon (50/100/200)
Add clarity to long-term trend direction with layered Exponential Moving Averages in key institutional periods.
Volatility-Adjusted Oscillator
A color-changing oscillator calculated from the normalized deviation between price and the selected MA. This helps identify trend shifts and momentum buildups.
Custom MA Line Widths and Styling
Full control over the width and appearance of all MA lines for visual clarity.
Bar & Candle Coloring
Bars and candles dynamically change color based on the relationship between price and the selected MA — helping you quickly assess bullish/bearish conditions.
Chandelier Exit
📈 How It Helps:
Spot early trend shifts through the oscillator.
Confirm trades using the alignment between ZLSMAs and EMAs.
Quickly assess current trend conditions using color-coded price bars.
Skrip open-source
Dengan semangat TradingView yang sesungguhnya, pembuat skrip ini telah menjadikannya sebagai sumber terbuka, sehingga para trader dapat meninjau dan memverifikasi fungsinya. Salut untuk penulisnya! Meskipun Anda dapat menggunakannya secara gratis, perlu diingat bahwa penerbitan ulang kode ini tunduk pada Tata Tertib kami.
Pernyataan Penyangkalan
Informasi dan publikasi ini tidak dimaksudkan, dan bukan merupakan, saran atau rekomendasi keuangan, investasi, trading, atau jenis lainnya yang diberikan atau didukung oleh TradingView. Baca selengkapnya di Ketentuan Penggunaan.