OPEN-SOURCE SCRIPT
Tick Chart RSI
Hello All,
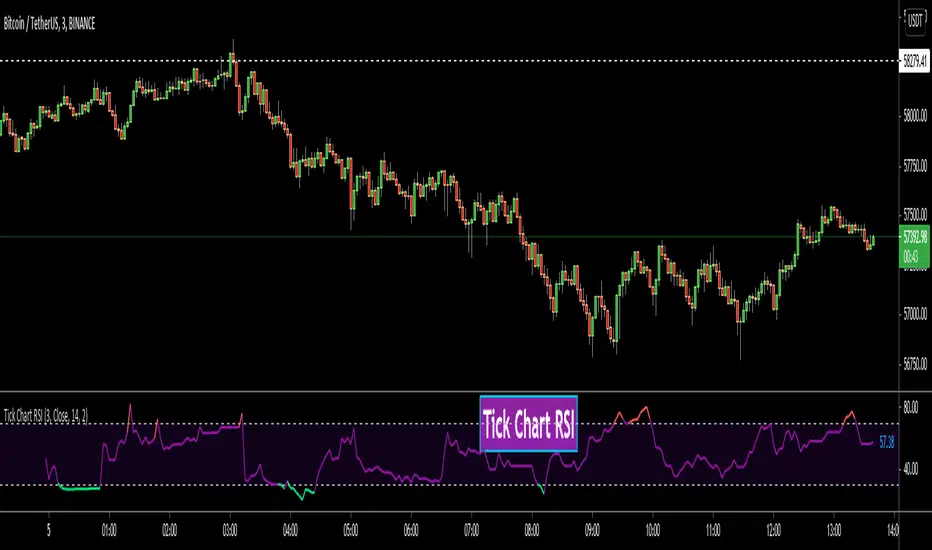
This is Tick Chart RSI script and it calculates & shows RSI for Tick Chart. What is Tick chart? Tick Chart is created using ticks and each candlestick in Tick Chart shows the price variation of X consecutive ticks (X : Number of Ticks Per Candle). For example if you set "Number of Ticks Per Candle" = 100 then each candlestick is created using 100 ticks. so, Tick Charts are NOT time-based charts (like Renko or Point & Figure Charts). Tick is the price change in minimum time interval defined in the platform. There are several advantages of Tick Charts. You can find many articles about Tick Charts on the net.
Tick Chart and Tick Chart RSI only work on realtime bars.
You can set "Number of Ticks Per Candle" and the colors. You can also set any of the candles OHLC values as source for RSI.
While using Tick Chart RSI I recommend you to add Tick Chart as well.
P.S. Tick Chart RSI script can be developed using different methods. in this script, all RSI values are calculated on each tick because RSI is calculated for only real-time bars, and also calculated for limited number of bars
Tick Chart and Tick Chart RSI:

Tick Chart RSI:

Enjoy!
This is Tick Chart RSI script and it calculates & shows RSI for Tick Chart. What is Tick chart? Tick Chart is created using ticks and each candlestick in Tick Chart shows the price variation of X consecutive ticks (X : Number of Ticks Per Candle). For example if you set "Number of Ticks Per Candle" = 100 then each candlestick is created using 100 ticks. so, Tick Charts are NOT time-based charts (like Renko or Point & Figure Charts). Tick is the price change in minimum time interval defined in the platform. There are several advantages of Tick Charts. You can find many articles about Tick Charts on the net.
Tick Chart and Tick Chart RSI only work on realtime bars.
You can set "Number of Ticks Per Candle" and the colors. You can also set any of the candles OHLC values as source for RSI.
While using Tick Chart RSI I recommend you to add Tick Chart as well.
P.S. Tick Chart RSI script can be developed using different methods. in this script, all RSI values are calculated on each tick because RSI is calculated for only real-time bars, and also calculated for limited number of bars
Tick Chart and Tick Chart RSI:
Tick Chart RSI:
Enjoy!
Skrip open-source
Dengan semangat TradingView yang sesungguhnya, pembuat skrip ini telah menjadikannya sebagai sumber terbuka, sehingga para trader dapat meninjau dan memverifikasi fungsinya. Salut untuk penulisnya! Meskipun Anda dapat menggunakannya secara gratis, perlu diingat bahwa penerbitan ulang kode ini tunduk pada Tata Tertib kami.
🤝 LonesomeTheBlue community
t.me/LonesomeTheBlue_Official
🎦 YouTube Channel
Youtube.com/@lonesometheblue/videos
💰 Subscription to Pro indicators
Tradingview.com/spaces/LonesomeTheBlue/
t.me/LonesomeTheBlue_Official
🎦 YouTube Channel
Youtube.com/@lonesometheblue/videos
💰 Subscription to Pro indicators
Tradingview.com/spaces/LonesomeTheBlue/
Pernyataan Penyangkalan
Informasi dan publikasi ini tidak dimaksudkan, dan bukan merupakan, saran atau rekomendasi keuangan, investasi, trading, atau jenis lainnya yang diberikan atau didukung oleh TradingView. Baca selengkapnya di Ketentuan Penggunaan.