OPEN-SOURCE SCRIPT
Diupdate BTC Indicator By Megalodon Trading
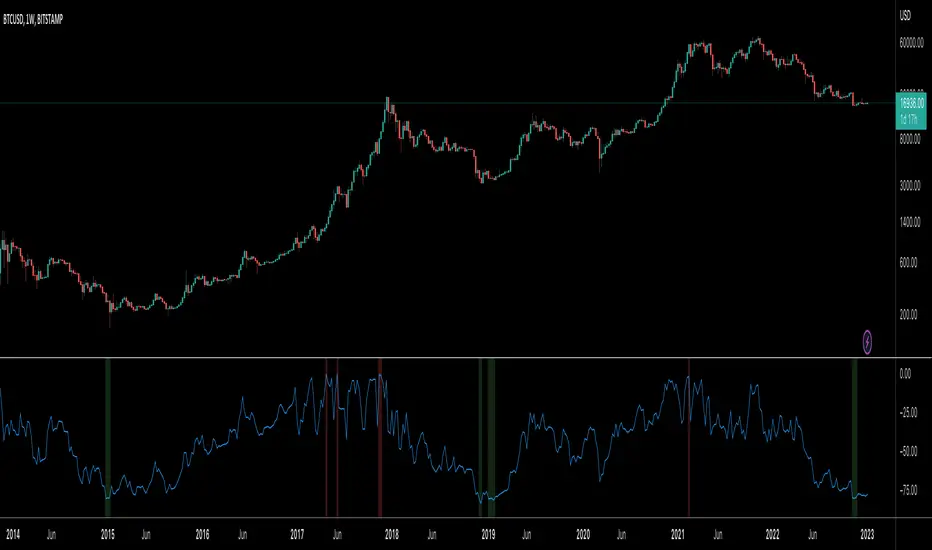
This indicator is designed help you see the potential reversal zones and it helps you accumulate for the long run.
This combines price data on any chart. The chart isolates between 0 and -100. Below -80 is a buy, above -20 is a sell location.
In these locations, try to Slowly Buy and Slowly Sell (accumulate...)
Story Of This Indicator
~I was always obsessed with Fibonacci and used Fibonacci all the time. Thus, i wanted to make a tool to see buying locations and selling locations.
Instead of drawing fibonacci's and manually interpreting buy/sell locations, i wanted algorithms to do the job for me. So, i created this algorithm and many more like it.
If you think i did a good job and want to do further work with me, feel free to contact.
I have a ton of other tools that can change everything for your trading/investing.
Best wishes
~Megalodon
Catatan Rilis
Added new settings for buy and sell levels. Skrip open-source
Dengan semangat TradingView yang sesungguhnya, pembuat skrip ini telah menjadikannya sebagai sumber terbuka, sehingga para trader dapat meninjau dan memverifikasi fungsinya. Salut untuk penulisnya! Meskipun Anda dapat menggunakannya secara gratis, perlu diingat bahwa penerbitan ulang kode ini tunduk pada Tata Tertib kami.
Telegram Here t.me/bugrasukas
Pernyataan Penyangkalan
Informasi dan publikasi ini tidak dimaksudkan, dan bukan merupakan, saran atau rekomendasi keuangan, investasi, trading, atau jenis lainnya yang diberikan atau didukung oleh TradingView. Baca selengkapnya di Ketentuan Penggunaan.
Skrip open-source
Dengan semangat TradingView yang sesungguhnya, pembuat skrip ini telah menjadikannya sebagai sumber terbuka, sehingga para trader dapat meninjau dan memverifikasi fungsinya. Salut untuk penulisnya! Meskipun Anda dapat menggunakannya secara gratis, perlu diingat bahwa penerbitan ulang kode ini tunduk pada Tata Tertib kami.
Telegram Here t.me/bugrasukas
Pernyataan Penyangkalan
Informasi dan publikasi ini tidak dimaksudkan, dan bukan merupakan, saran atau rekomendasi keuangan, investasi, trading, atau jenis lainnya yang diberikan atau didukung oleh TradingView. Baca selengkapnya di Ketentuan Penggunaan.