OPEN-SOURCE SCRIPT
Relative Strength vs Benchmark SPY

Relative Strength vs Benchmark (SPY)
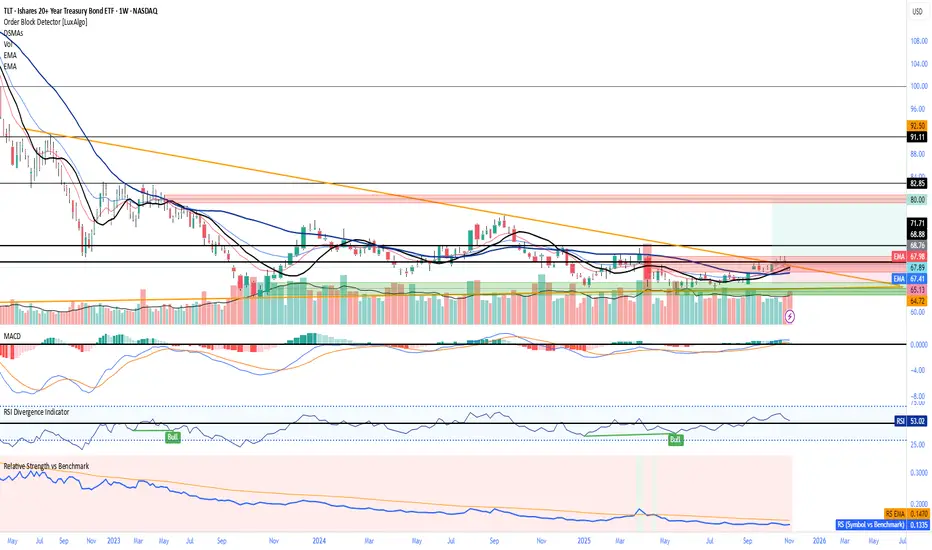
This indicator compares the performance of the charted symbol (stock or ETF) against a benchmark index — by default, SPY (S&P 500). It plots a Relative Strength (RS) ratio line (Symbol / SPY) and its EMA(50) to visualize when the asset is outperforming or underperforming the market.
Key Features
📈 RS Line (blue): Shows how the asset performs relative to SPY.
🟠 EMA(50): Smooths the RS trend to highlight sustained leadership.
🟩 Green background: Symbol is outperforming SPY (RS > EMA).
🟥 Red background: Symbol is underperforming SPY (RS < EMA).
🔔 Alerts: Automatic notifications when RS crosses above/below its EMA — signaling new leadership or weakness.
How to Use
Apply to any stock or ETF chart.
Keep benchmark = SPY, or switch to another index (e.g., QQQ, IWM, XLK).
Watch for RS crossovers and trends:
Rising RS → money flowing into the asset.
Falling RS → rotation away from the asset.
Perfect for sector rotation, ETF comparison, and momentum analysis workflows.
Skrip open-source
Dengan semangat TradingView yang sesungguhnya, pembuat skrip ini telah menjadikannya sebagai sumber terbuka, sehingga para trader dapat meninjau dan memverifikasi fungsinya. Salut untuk penulisnya! Meskipun Anda dapat menggunakannya secara gratis, perlu diingat bahwa penerbitan ulang kode ini tunduk pada Tata Tertib kami.
Pernyataan Penyangkalan
Informasi dan publikasi ini tidak dimaksudkan, dan bukan merupakan, saran atau rekomendasi keuangan, investasi, trading, atau jenis lainnya yang diberikan atau didukung oleh TradingView. Baca selengkapnya di Ketentuan Penggunaan.