OPEN-SOURCE SCRIPT
Market Regime (w/ Adaptive Thresholds)
Logic Behind This Indicator
This indicator identifies market regimes (trending vs. mean-reverting) using adaptive thresholds that adjust to recent market conditions.
Core Components
1. Regime Score Calculation (0-100 scale)
Starts at 50 (neutral) and adjusts based on two factors:
A. Trend Strength
Compares fast EMA (5) vs. slow EMA (10)
If fast > slow by >1% → +60 points (strong uptrend)
If fast < slow by >1% → -60 points (strong downtrend)
B. RSI Momentum
Uses 7-period RSI smoothed with 3-period EMA
RSI > 70 → +20 points (overbought/trending)
RSI < 30 → -20 points (oversold/mean-reverting)
The score is then smoothed and clamped between 0-100.
2. Adaptive Thresholds
Instead of fixed levels, thresholds adjust to recent market behavior:
Looks back 100 bars to find the min/max regime score
High threshold = 80% of the range (trending regime)
Low threshold = 20% of the range (mean-reverting regime)
This prevents false signals in different volatility environments.
3. Regime Classification
Regime Score Classification Meaning
Above high threshold STRONG TREND Market is trending strongly (follow momentum)
Below low threshold STRONG MEAN REVERSION Market is choppy/oversold (fade moves)
Between thresholds NEUTRAL No clear regime (stay out or wait)
4. Regime Persistence Filter
Requires the regime to hold for a minimum number of bars (default: 1) before confirming
Prevents whipsaws from brief score fluctuations
What It Aims to Detect
Visual Cues
This indicator identifies market regimes (trending vs. mean-reverting) using adaptive thresholds that adjust to recent market conditions.
Core Components
1. Regime Score Calculation (0-100 scale)
Starts at 50 (neutral) and adjusts based on two factors:
A. Trend Strength
Compares fast EMA (5) vs. slow EMA (10)
If fast > slow by >1% → +60 points (strong uptrend)
If fast < slow by >1% → -60 points (strong downtrend)
B. RSI Momentum
Uses 7-period RSI smoothed with 3-period EMA
RSI > 70 → +20 points (overbought/trending)
RSI < 30 → -20 points (oversold/mean-reverting)
The score is then smoothed and clamped between 0-100.
2. Adaptive Thresholds
Instead of fixed levels, thresholds adjust to recent market behavior:
Looks back 100 bars to find the min/max regime score
High threshold = 80% of the range (trending regime)
Low threshold = 20% of the range (mean-reverting regime)
This prevents false signals in different volatility environments.
3. Regime Classification
Regime Score Classification Meaning
Above high threshold STRONG TREND Market is trending strongly (follow momentum)
Below low threshold STRONG MEAN REVERSION Market is choppy/oversold (fade moves)
Between thresholds NEUTRAL No clear regime (stay out or wait)
4. Regime Persistence Filter
Requires the regime to hold for a minimum number of bars (default: 1) before confirming
Prevents whipsaws from brief score fluctuations
What It Aims to Detect
- When to use trend-following strategies (green = buy breakouts, ride momentum)
- When to use mean-reversion strategies (red = buy dips, sell rallies)
- When to stay out (gray = unclear conditions, high risk of false signals)
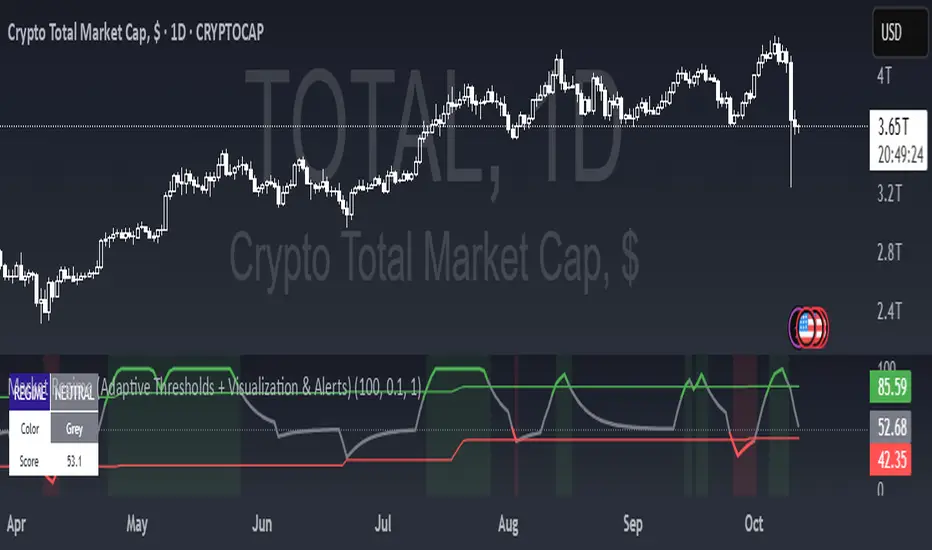
Visual Cues
- Green background = Strong trend (momentum strategies work)
- Red background = Strong mean reversion (contrarian strategies work)
- Table = Shows current regime, color, and score
- Alerts = Notifies when regime changes
Skrip open-source
Dengan semangat TradingView yang sesungguhnya, pembuat skrip ini telah menjadikannya sebagai sumber terbuka, sehingga para trader dapat meninjau dan memverifikasi fungsinya. Salut untuk penulisnya! Meskipun Anda dapat menggunakannya secara gratis, perlu diingat bahwa penerbitan ulang kode ini tunduk pada Tata Tertib kami.
Pernyataan Penyangkalan
Informasi dan publikasi ini tidak dimaksudkan, dan bukan merupakan, saran atau rekomendasi keuangan, investasi, trading, atau jenis lainnya yang diberikan atau didukung oleh TradingView. Baca selengkapnya di Ketentuan Penggunaan.