OPEN-SOURCE SCRIPT
DMI Stochastic Extereme
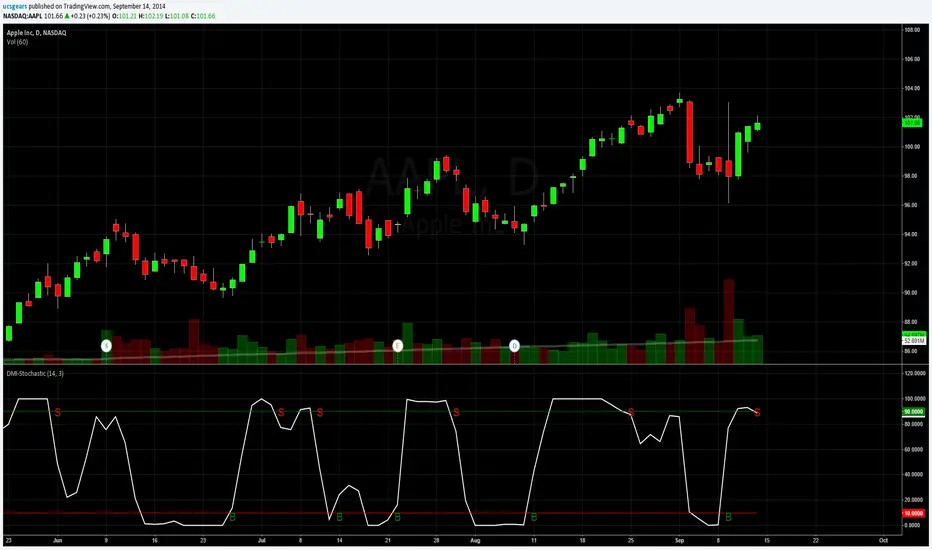
USed the DMI Oscillator created by LARK "tradingview.com/v/T79b6F5n/" to create this DMI Stochastic Extreme. You can also use the DMI Stochastic by Lark tradingview.com/v/O50vyKmV/.
Updated Version - tradingview.com/v/xUXuZ3Ki/ [Version 2]
Updated Version - tradingview.com/v/xUXuZ3Ki/ [Version 2]
Skrip open-source
Dengan semangat TradingView yang sesungguhnya, pembuat skrip ini telah menjadikannya sebagai sumber terbuka, sehingga para trader dapat meninjau dan memverifikasi fungsinya. Salut untuk penulisnya! Meskipun Anda dapat menggunakannya secara gratis, perlu diingat bahwa penerbitan ulang kode ini tunduk pada Tata Tertib kami.
Uday C Santhakumar
udaycs.substack.com/
udaycs.substack.com/
Pernyataan Penyangkalan
Informasi dan publikasi ini tidak dimaksudkan, dan bukan merupakan, saran atau rekomendasi keuangan, investasi, trading, atau jenis lainnya yang diberikan atau didukung oleh TradingView. Baca selengkapnya di Ketentuan Penggunaan.