OPEN-SOURCE SCRIPT
Diupdate StochCMO - Stochastic CMO [SHK]
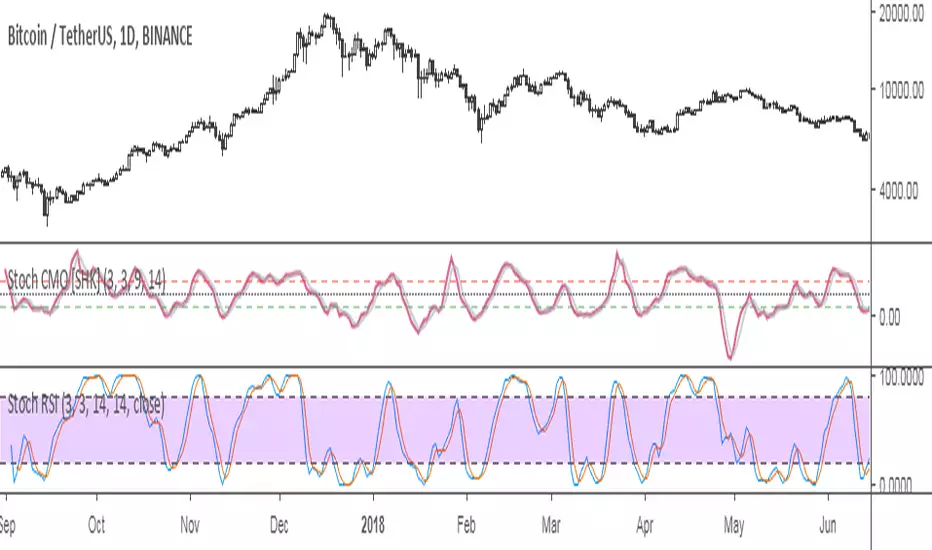
StochCMO is the combination of Stochastic and CMO (Chande Momentum Oscillator).
The StochCMO is an indicator used in technical analysis that ranges between zero and one and is created by applying the Stochastic Oscillator formula to a set of Chande Momentum Oscillator (CMO) values rather than standard price data. Using CMO values within the Stochastic formula gives traders an idea of whether the current CMO value is overbought or oversold - a measure that becomes specifically useful when the CMO value is confined between its signal levels of 20 and 80.
Usage:
The usage of StochCMO is similar to StochRSI.
StochCMO vs StochRSI:
The difference between these indicators can be realized by comparing CMO & RSI:
CMO is similar to the Relative Strength Index (RSI) except that it measures momentum on both up days and down days. The CMO also does not use internal smoothing and thus does not obscure short-term extremes in momentum. As a result, the CMO often reaches over bought and over sold areas more regularly than momentum indicators, such as the RSI, that have internal smoothing.
Hope it helps you.
Catatan Rilis
New Source CodeSkrip open-source
Dengan semangat TradingView yang sesungguhnya, pembuat skrip ini telah menjadikannya sebagai sumber terbuka, sehingga para trader dapat meninjau dan memverifikasi fungsinya. Salut untuk penulisnya! Meskipun Anda dapat menggunakannya secara gratis, perlu diingat bahwa penerbitan ulang kode ini tunduk pada Tata Tertib kami.
Pernyataan Penyangkalan
Informasi dan publikasi ini tidak dimaksudkan, dan bukan merupakan, saran atau rekomendasi keuangan, investasi, trading, atau jenis lainnya yang diberikan atau didukung oleh TradingView. Baca selengkapnya di Ketentuan Penggunaan.
Skrip open-source
Dengan semangat TradingView yang sesungguhnya, pembuat skrip ini telah menjadikannya sebagai sumber terbuka, sehingga para trader dapat meninjau dan memverifikasi fungsinya. Salut untuk penulisnya! Meskipun Anda dapat menggunakannya secara gratis, perlu diingat bahwa penerbitan ulang kode ini tunduk pada Tata Tertib kami.
Pernyataan Penyangkalan
Informasi dan publikasi ini tidak dimaksudkan, dan bukan merupakan, saran atau rekomendasi keuangan, investasi, trading, atau jenis lainnya yang diberikan atau didukung oleh TradingView. Baca selengkapnya di Ketentuan Penggunaan.