OPEN-SOURCE SCRIPT
EMA HI/LO Cloud
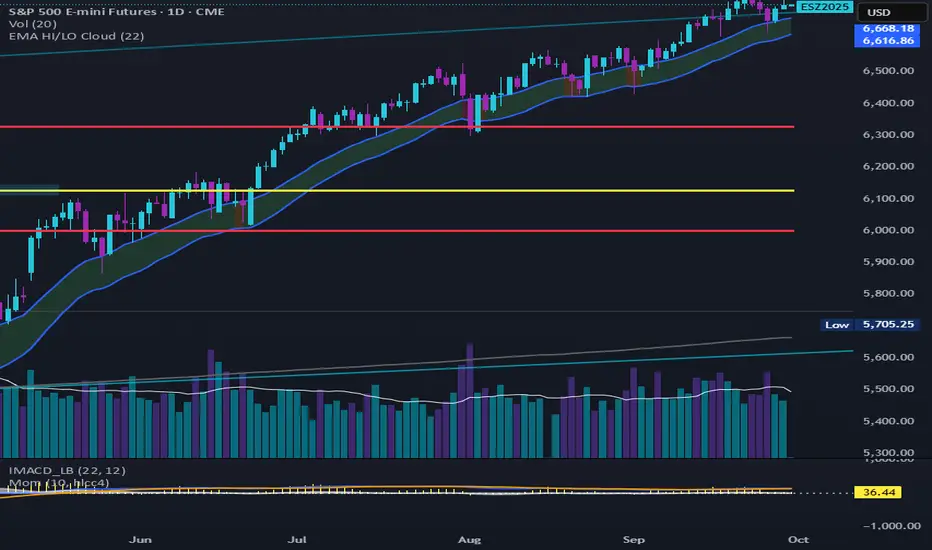
📌 EMA High/Low Buy-Sell Labels Indicator
This indicator generates simple Buy and Sell signals based on price interaction with two dynamic levels:
EMA High → Exponential Moving Average calculated from candle highs.
EMA Low → Exponential Moving Average calculated from candle lows.
🔑 How it Works
A Buy signal prints when the closing price crosses above the EMA High.
A Sell signal prints when the closing price crosses below the EMA Low.
Signals are marked directly on the chart with customizable labels — you can change the shape, size, and colors of the Buy and Sell labels to match your trading style.
The indicator does not plot the EMAs, keeping the chart clean and focused only on the entry/exit labels.
⚡ Use Case
Helps traders quickly identify potential trend breakouts (price strength above EMA High) or trend breakdowns (price weakness below EMA Low).
Works on any timeframe and any market (stocks, forex, crypto, futures, etc.).
Can be used standalone or combined with other indicators for confirmation.
🎯 Best For
Traders who want minimalist chart signals without clutter.
Trend-following strategies where confirmation of momentum is key.
Entry/Exit marking without needing to constantly watch EMA bands.
Skrip open-source
Dengan semangat TradingView yang sesungguhnya, penulis skrip ini telah menjadikannya sumber terbuka, sehingga para trader dapat meninjau dan memverifikasi fungsinya. Hormat untuk penulisnya! Meskipun anda dapat menggunakannya secara gratis, ingatlah bahwa penerbitan ulang kode tersebut tunduk pada Tata Tertib kami.
Pernyataan Penyangkalan
Informasi dan publikasi tidak dimaksudkan untuk menjadi, dan bukan merupakan saran keuangan, investasi, perdagangan, atau rekomendasi lainnya yang diberikan atau didukung oleh TradingView. Baca selengkapnya di Persyaratan Penggunaan.