PROTECTED SOURCE SCRIPT
GFM Analyst 01 - Price Action & EMAs
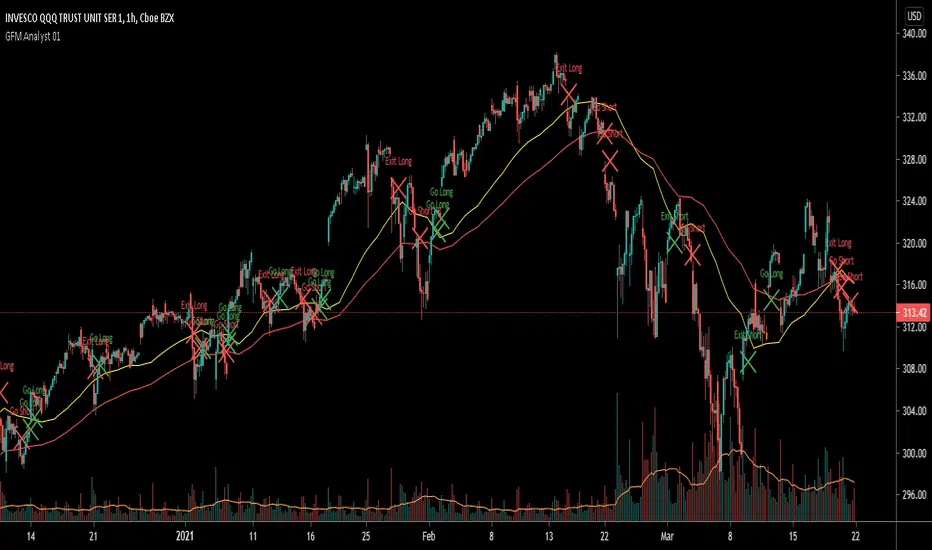
This indicator will help in identifying trends. It is using the historic price action to determine the Buy and Sell signals.
Also we have used the Exponential Moving Averages on a daily timeframe (resolution/period). This will help is eradicate any false signals.
Yellow Line = Fast Exponential Moving Average
Red Line = Slow Exponential Moving Average
On a shorter timeframe, one should ignore short signals, if the price is moving above these two EMA's and similarly ignore long signals, if the price is moving below these two EMA's.
Skrip terproteksi
Skrip ini diterbitkan sebagai sumber tertutup. Namun, Anda dapat menggunakannya dengan bebas dan tanpa batasan apa pun – pelajari lebih lanjut di sini.
Pernyataan Penyangkalan
Informasi dan publikasi ini tidak dimaksudkan, dan bukan merupakan, saran atau rekomendasi keuangan, investasi, trading, atau jenis lainnya yang diberikan atau didukung oleh TradingView. Baca selengkapnya di Ketentuan Penggunaan.