PROTECTED SOURCE SCRIPT
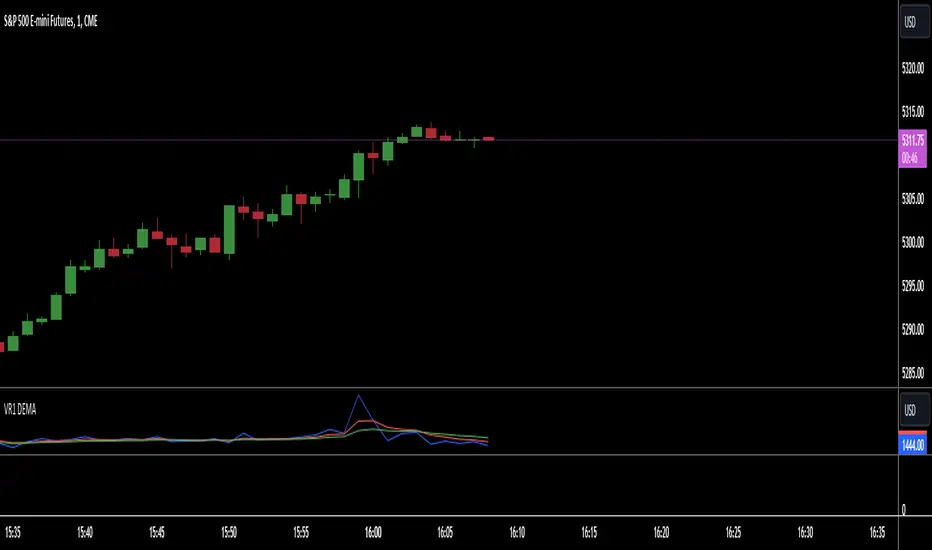
VR1 DEMA

Sure, here's a description for the "Volume Range Dual EMA" indicator:
---
**Indicator Name:** Volume Range Dual EMA
**Description:**
The "Volume Range Dual EMA" indicator is a technical analysis tool designed for TradingView charts. It calculates the ratio of volume to the price range of each bar and plots two Exponential Moving Averages (EMAs) of this ratio.
**Usage:**
- This indicator helps traders analyze the relationship between volume and price range in a given timeframe.
- The primary purpose of the indicator is to identify trends and potential changes in market sentiment based on volume and price movements.
- Traders can adjust the lengths of the EMAs according to their trading strategies and preferences.
- When the shorter EMA crosses above the longer EMA, it may signal a bullish trend, whereas a crossover in the opposite direction could indicate a bearish trend.
**Parameters:**
1. **EMA Length 1:** Defines the length of the first Exponential Moving Average (EMA) used in the calculation.
2. **EMA Length 2:** Defines the length of the second Exponential Moving Average (EMA) used in the calculation.
Skrip terproteksi
Skrip ini diterbitkan sebagai sumber tertutup. Namun, anda dapat menggunakannya secara bebas dan tanpa batasan apa pun – pelajari lebih lanjut di sini.
Pernyataan Penyangkalan
Informasi dan publikasi tidak dimaksudkan untuk menjadi, dan bukan merupakan saran keuangan, investasi, perdagangan, atau rekomendasi lainnya yang diberikan atau didukung oleh TradingView. Baca selengkapnya di Persyaratan Penggunaan.