PROTECTED SOURCE SCRIPT
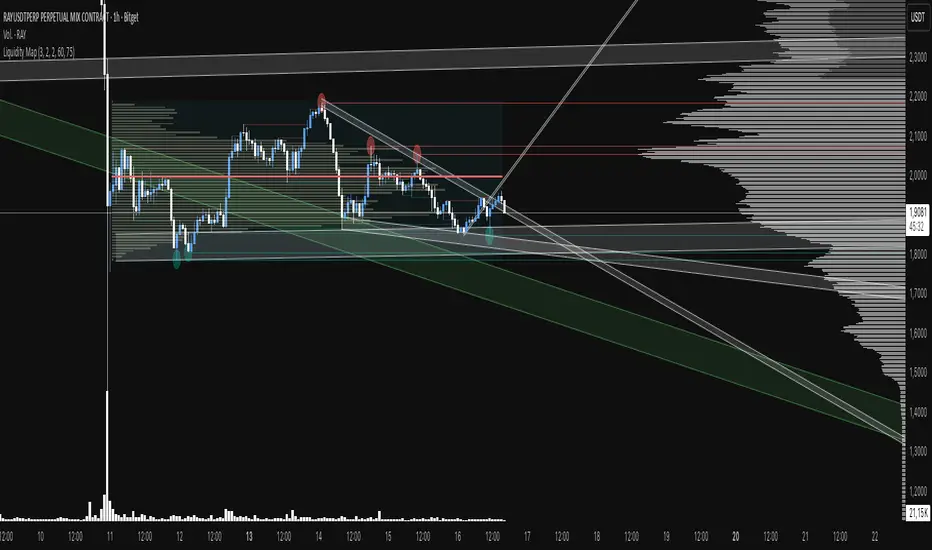
Liquidity Map [DrewRS]
Donations are welcome to keep building!!
https://paypal.me/anrusa
Description
Liquidity Map highlights where recent swing highs/lows leave resting liquidity and shows when those pools are swept; pending zones keep their color while swept zones fade, so you can track which areas remain attractive for price.
Each pivot detection draws a horizontal line plus a tiny marker, with optional equal-high/low highlighting to emphasize double tops/bottoms that are often targeted; when price runs through the level the marker disappears and a “taken” dot is left behind.
Designed for discretionary traders who monitor liquidity grabs, imbalances, or SMT setups; works on any symbol or timeframe, though you may want tighter settings for intraday and wider ones for higher timeframes.
How It Works
Uses ta.pivothigh / ta.pivotlow to define swing points; every pivot draws a persistent level until price closes a candle beyond it.
Equal highs/lows within the chosen tick tolerance upgrade the level color for quick visual prioritization.
Liquidity sweeps shorten the line to the sweep bar, reduce opacity with the “Line opacity after sweep” control, and leave a colored dot so you can see which pool was taken.
Inputs
Left/Right pivot bars: increase for smoother swings, decrease for faster detection.
Equal high/low tolerance: small values flag only near-perfect doubles; larger tolerances bundle broader ranges.
Max levels per side: caps how many pending lines stay on chart to avoid clutter.
Plot marker when liquidity is taken: toggle sweep dots on/off.
Pending/Taken liquidity colors + Line opacity after sweep: adjust palette to fit your chart theme.
Tips
Combine with market-structure or order-block tools; pending liquidity often aligns with supply/demand zones.
For scalping, start with leftBars = 2, rightBars = 1, and a tighter tolerance; for swing trading, raise the bars and tolerance slightly.
Keep an eye on equal highs/lows that stack across timeframes—multiple confluences tend to attract price more aggressively.
Skrip terproteksi
Skrip ini diterbitkan sebagai sumber tertutup. Namun, anda dapat menggunakannya secara bebas dan tanpa batasan apa pun – pelajari lebih lanjut di sini.
Pernyataan Penyangkalan
Informasi dan publikasi tidak dimaksudkan untuk menjadi, dan bukan merupakan saran keuangan, investasi, perdagangan, atau rekomendasi lainnya yang diberikan atau didukung oleh TradingView. Baca selengkapnya di Persyaratan Penggunaan.