OPEN-SOURCE SCRIPT
RSI Multi Length [LuxAlgo]
The following indicator aims to return information over RSIs using multiple periods, including the percentage of RSIs of different periods being overbought/oversold, as well as the average between these multiple RSIs.
The percentage of RSIs of different periods being overbought/oversold is additionally used to return adaptive overbought/oversold levels.
Settings
Usage

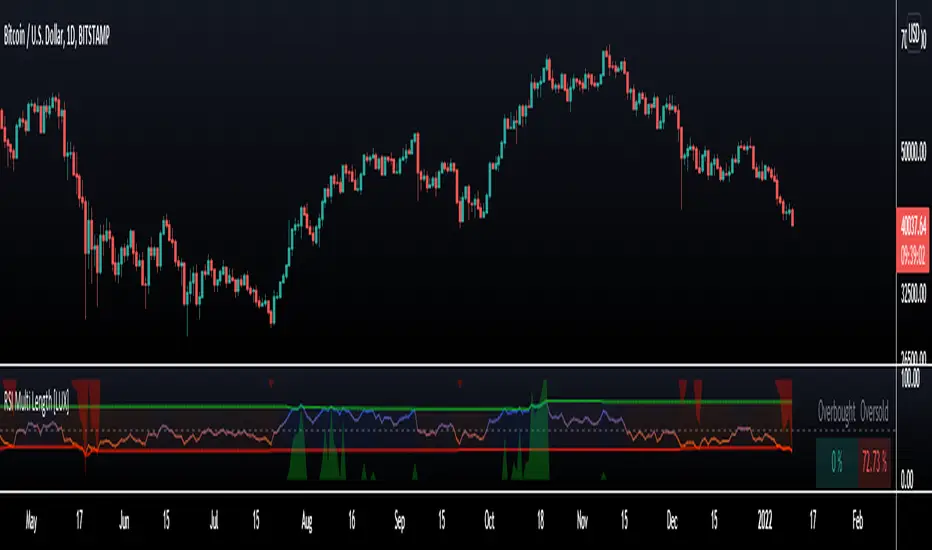
The main element of the indicator is given by the multi-length RSI average, returning an oscillator similar to a fixed-length RSI. Because of its multiple length nature, the indicator can reflect shorter to longer-term price variations depending on the Maximum/Minimum length range defined by the user.
The green area indicates the percentage of RSIs over the user-defined overbought level. The red area indicates the percentage of RSIs under the user-defined oversold level, this percentage is inverted for ease of visualization. Additionally, a dashboard at the top right of the indicator pane indicates these percentages for the most recent bar.

A lower percentage of overbought/oversold RSIs can indicate a potential shorter-term retracement.
These percentages are used to construct adaptive overbought/oversold levels for the average multi-length RSI. The overbought level will be easier to reach if the percentage of overbought RSI's is high, the same logic applies to the adaptive oversold level.
The percentage of RSIs of different periods being overbought/oversold is additionally used to return adaptive overbought/oversold levels.
Settings
- Maximum Length: Maximum period of the RSI used for the indicator calculation
- Minimum Length: Minimum period value of the RSI used for the indicator calculation
- Overbought: Value of the overbought level
- Oversold: Value of the oversold level
- Src: Input source of the indicator
Usage
The main element of the indicator is given by the multi-length RSI average, returning an oscillator similar to a fixed-length RSI. Because of its multiple length nature, the indicator can reflect shorter to longer-term price variations depending on the Maximum/Minimum length range defined by the user.
The green area indicates the percentage of RSIs over the user-defined overbought level. The red area indicates the percentage of RSIs under the user-defined oversold level, this percentage is inverted for ease of visualization. Additionally, a dashboard at the top right of the indicator pane indicates these percentages for the most recent bar.
A lower percentage of overbought/oversold RSIs can indicate a potential shorter-term retracement.
These percentages are used to construct adaptive overbought/oversold levels for the average multi-length RSI. The overbought level will be easier to reach if the percentage of overbought RSI's is high, the same logic applies to the adaptive oversold level.
Catatan Rilis
Minor changes.Skrip open-source
Dengan semangat TradingView yang sesungguhnya, pembuat skrip ini telah menjadikannya sebagai sumber terbuka, sehingga para trader dapat meninjau dan memverifikasi fungsinya. Salut untuk penulisnya! Meskipun Anda dapat menggunakannya secara gratis, perlu diingat bahwa penerbitan ulang kode ini tunduk pada Tata Tertib kami.
Get exclusive indicators & AI trading strategies: luxalgo.com
Free 150k+ community: discord.gg/lux
All content provided by LuxAlgo is for informational & educational purposes only. Past performance does not guarantee future results.
Free 150k+ community: discord.gg/lux
All content provided by LuxAlgo is for informational & educational purposes only. Past performance does not guarantee future results.
Pernyataan Penyangkalan
Informasi dan publikasi ini tidak dimaksudkan, dan bukan merupakan, saran atau rekomendasi keuangan, investasi, trading, atau jenis lainnya yang diberikan atau didukung oleh TradingView. Baca selengkapnya di Ketentuan Penggunaan.
Skrip open-source
Dengan semangat TradingView yang sesungguhnya, pembuat skrip ini telah menjadikannya sebagai sumber terbuka, sehingga para trader dapat meninjau dan memverifikasi fungsinya. Salut untuk penulisnya! Meskipun Anda dapat menggunakannya secara gratis, perlu diingat bahwa penerbitan ulang kode ini tunduk pada Tata Tertib kami.
Get exclusive indicators & AI trading strategies: luxalgo.com
Free 150k+ community: discord.gg/lux
All content provided by LuxAlgo is for informational & educational purposes only. Past performance does not guarantee future results.
Free 150k+ community: discord.gg/lux
All content provided by LuxAlgo is for informational & educational purposes only. Past performance does not guarantee future results.
Pernyataan Penyangkalan
Informasi dan publikasi ini tidak dimaksudkan, dan bukan merupakan, saran atau rekomendasi keuangan, investasi, trading, atau jenis lainnya yang diberikan atau didukung oleh TradingView. Baca selengkapnya di Ketentuan Penggunaan.