OPEN-SOURCE SCRIPT
kama

█ Description
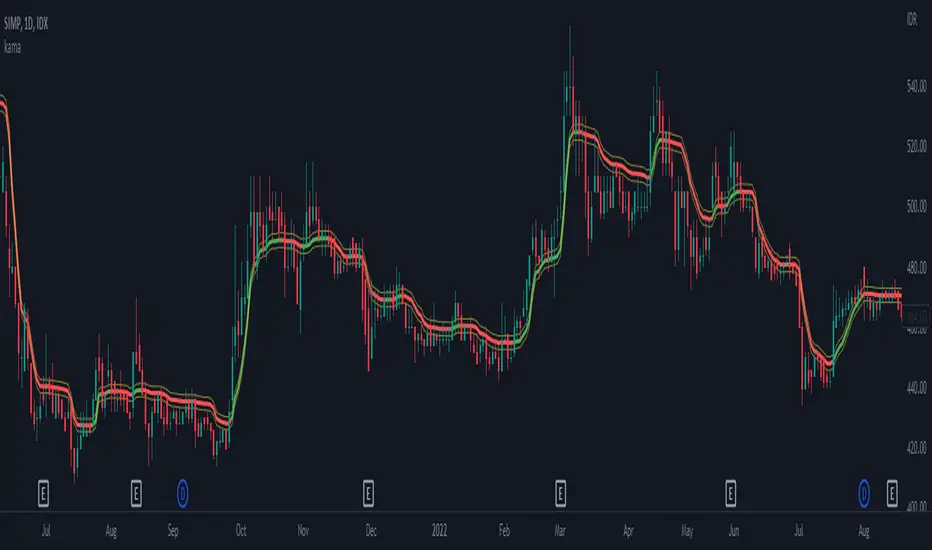
An adaptive indicator could be defined as market conditions following indicator, in summary, the parameter of the indicator would be adjusted to fit its optimum value to the current price action. KAMA, Kaufman's Adaptive Moving Average, an adaptive trendline indicator developed by Perry J. Kaufman, with the notion of using the fastest trend possible based on the smallest calculation period for the existing market conditions, by applying an exponential smoothing formula to vary the speed of the trend (changing smoothing constant each period), as cited from Trading Systems and Methods p.g. 780 (Perry J. Kaufman). In this indicator, the proposed notion is on the Efficiency Ratio within the computation of KAMA, which will use a Dominant Cycle instead, an adaptive filter developed by John F. Ehlers, on determining the n periods, aiming to achieve an optimum lookback period, with respect to the original Efficiency Ratio calculation period of less than 14, and 8 to 10 is preferable.
█ Kaufman's Adaptive Moving Average
kama_ = kama[1] + smoothing_constant * (price - kama[1])
where:
price = current price (source)
smoothing_constant = (efficiency_ratio * (fastest - slowest) + slowest)^2
fastest = 2/(fastest length + 1)
slowest = 2/(slowest length + 1)
efficiency_ratio = price - price[int(dominant_cycle)]/sum(abs(src - src[1], int(dominant_cycle))
█ Feature
- The indicator will have a specified default parameter of: length = 14; fast_length = 2; slow_length = 30; hp_period = 48; source = ohlc4
- KAMA trendline i.e. output value if price above the trendline and trendline indicates with green color, consider to buy/long position
- while, if the price is below the trendline and the trendline indicates red color, consider to sell/short position
- Hysteresis Band
- Bar Color
other example
Skrip open-source
Dengan semangat TradingView yang sesungguhnya, pembuat skrip ini telah menjadikannya sebagai sumber terbuka, sehingga para trader dapat meninjau dan memverifikasi fungsinya. Salut untuk penulisnya! Meskipun Anda dapat menggunakannya secara gratis, perlu diingat bahwa penerbitan ulang kode ini tunduk pada Tata Tertib kami.
Pernyataan Penyangkalan
Informasi dan publikasi ini tidak dimaksudkan, dan bukan merupakan, saran atau rekomendasi keuangan, investasi, trading, atau jenis lainnya yang diberikan atau didukung oleh TradingView. Baca selengkapnya di Ketentuan Penggunaan.