OPEN-SOURCE SCRIPT
Motion Smoothness Index
Introduction
Its holiday time for me, i have been working here a lot. But no leaving before publishing. Telling when market price is smooth or rough is not the easiest task, so today i present a trend metric indicator that allow you to give you this kind of information.
The Indicator
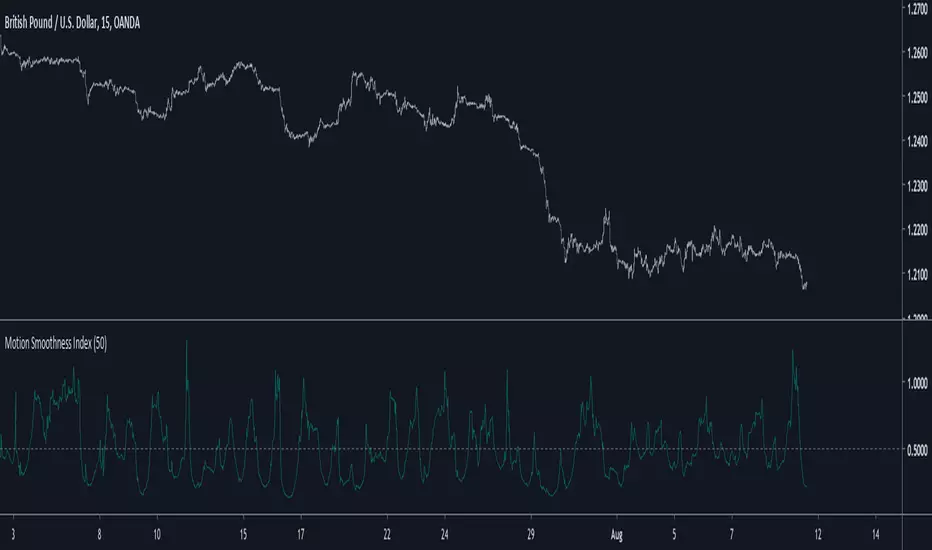
The indicator is in an approximate range of (0,1) with mean x̄ decaying for higher length's, when the indicator is below 0.5 the market is smooth, else rough, this is the simple interpretation. The indicator is simply the ratio of the price residual standard deviation and the price standard deviation.
Higher value of length will make the indicator less accurate when it comes to detect rough market price, you can still use the indicator direction or its running mean to give you insights but 0.5 is still the recommended detection threshold.
In More Depth
Even tho market is random by nature there can still be structures in the price (cycles and trends), the fractional BM model will tell you that market price is sometimes auto-correlated (trending) or non auto-correlated (ranging), knowing what is the current market state is therefore important, when price is rough it can means an excess in noise thus exhibiting an uncorrelated market at the contrary of a smoother price that can allow for auto-correlation.
Now, market is infected by noise, and thats really unfortunate but the noise posses various properties that can allow for all the structures we see in market price. So thinking about the market allowing for possible profits during auto-correlated states is encouraging.
Conclusion
Although the indicator measure smoothness/roughness it can still be interpreted as a trend/range state detector. I hope it provide to be useful.
I wish you all good holidays and see you next time ! Thanks for reading !
Its holiday time for me, i have been working here a lot. But no leaving before publishing. Telling when market price is smooth or rough is not the easiest task, so today i present a trend metric indicator that allow you to give you this kind of information.
The Indicator
The indicator is in an approximate range of (0,1) with mean x̄ decaying for higher length's, when the indicator is below 0.5 the market is smooth, else rough, this is the simple interpretation. The indicator is simply the ratio of the price residual standard deviation and the price standard deviation.
Higher value of length will make the indicator less accurate when it comes to detect rough market price, you can still use the indicator direction or its running mean to give you insights but 0.5 is still the recommended detection threshold.
In More Depth
Even tho market is random by nature there can still be structures in the price (cycles and trends), the fractional BM model will tell you that market price is sometimes auto-correlated (trending) or non auto-correlated (ranging), knowing what is the current market state is therefore important, when price is rough it can means an excess in noise thus exhibiting an uncorrelated market at the contrary of a smoother price that can allow for auto-correlation.
Now, market is infected by noise, and thats really unfortunate but the noise posses various properties that can allow for all the structures we see in market price. So thinking about the market allowing for possible profits during auto-correlated states is encouraging.
Conclusion
Although the indicator measure smoothness/roughness it can still be interpreted as a trend/range state detector. I hope it provide to be useful.
I wish you all good holidays and see you next time ! Thanks for reading !
Skrip open-source
Dengan semangat TradingView yang sesungguhnya, pembuat skrip ini telah menjadikannya sebagai sumber terbuka, sehingga para trader dapat meninjau dan memverifikasi fungsinya. Salut untuk penulisnya! Meskipun Anda dapat menggunakannya secara gratis, perlu diingat bahwa penerbitan ulang kode ini tunduk pada Tata Tertib kami.
Check out the indicators we are making at luxalgo: tradingview.com/u/LuxAlgo/
"My heart is so loud that I can't hear the fireworks"
"My heart is so loud that I can't hear the fireworks"
Pernyataan Penyangkalan
Informasi dan publikasi ini tidak dimaksudkan, dan bukan merupakan, saran atau rekomendasi keuangan, investasi, trading, atau jenis lainnya yang diberikan atau didukung oleh TradingView. Baca selengkapnya di Ketentuan Penggunaan.