OPEN-SOURCE SCRIPT
MAD Ratio with Buy/Sell Signals
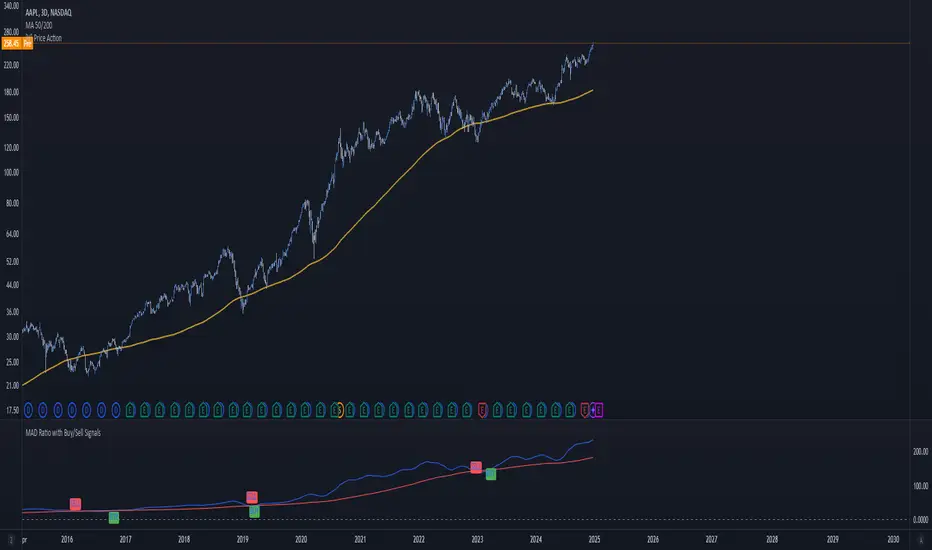
This code creates an indicator that generates Buy and Sell signals based on the Moving Average Distance (MAD) Ratio and the crossover/crossunder of two Simple Moving Averages (SMA). Here's a breakdown of what it does:
What the Indicator Shows:
Moving Averages:
21-day SMA (shortMA): Plotted in blue.
200-day SMA (longMA): Plotted in red.
These lines visually represent short-term and long-term trends in price.
Horizontal Reference Line:
A gray horizontal line at Ratio = 1 marks when the 21-day SMA and 200-day SMA are equal. This is the neutral point for the MAD ratio.
Buy and Sell Signals:
Buy Signal (Green Label):
Triggered when:
MAD Ratio > 1 (shortMA is greater than longMA, indicating upward momentum).
The 21-day SMA crosses above the 200-day SMA.
Displays a green "BUY" label below the price chart.
Sell Signal (Red Label):
Triggered when:
MAD Ratio < 1 (shortMA is less than longMA, indicating downward momentum).
The 21-day SMA crosses below the 200-day SMA.
Displays a red "SELL" label above the price chart.
Skrip open-source
Dengan semangat TradingView yang sesungguhnya, pembuat skrip ini telah menjadikannya sebagai sumber terbuka, sehingga para trader dapat meninjau dan memverifikasi fungsinya. Salut untuk penulisnya! Meskipun Anda dapat menggunakannya secara gratis, perlu diingat bahwa penerbitan ulang kode ini tunduk pada Tata Tertib kami.
Pernyataan Penyangkalan
Informasi dan publikasi ini tidak dimaksudkan, dan bukan merupakan, saran atau rekomendasi keuangan, investasi, trading, atau jenis lainnya yang diberikan atau didukung oleh TradingView. Baca selengkapnya di Ketentuan Penggunaan.