OPEN-SOURCE SCRIPT
BB phases

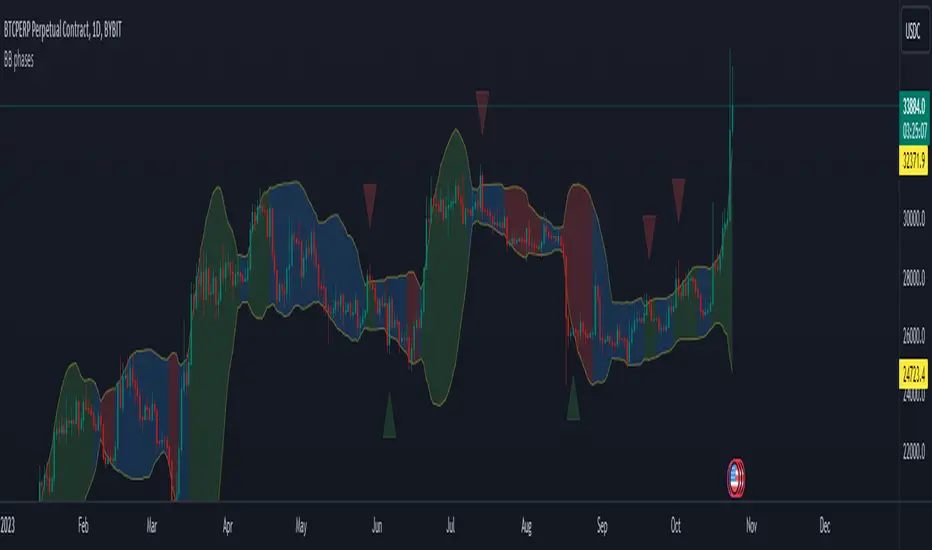
This indicator is designed to visually represent different market phases based on Bollinger Bands (BB) and provide insights into potential bullish and bearish signals. Let's break down what the indicator does:
The indicator smoothly transitions from the "squeeze" phase to "bullish" or "bearish" phases based on specific price conditions. Here's a more detailed explanation of how this transition occurs:
Another feature of the indicator is to display bearish/bullish triangles when the price reintegrate the bollinger bands after it previously breaked it. For example if the price closes below the lower BB and then the next candle in above the lower BB, a bullish triangle will be displayed.
The indicator smoothly transitions from the "squeeze" phase to "bullish" or "bearish" phases based on specific price conditions. Here's a more detailed explanation of how this transition occurs:
- Squeeze Phase: The "squeeze" phase is identified when the closing price is within the range between the upper Bollinger Band (upper BB) and the lower Bollinger Band (lower BB).
- Transition to Bullish Phase: The transition from "squeeze" to "bullish" phase occurs when the price closes above the upper BB. The bullish phase will last while the price hasn't closed below the middle BB.
- Transition to Bearish Phase: Conversely, the transition from "squeeze" to "bearish" phase occurs when the price closes below the lower BB. The bearish phase will last while the price hasn't closed above the middle BB.
Another feature of the indicator is to display bearish/bullish triangles when the price reintegrate the bollinger bands after it previously breaked it. For example if the price closes below the lower BB and then the next candle in above the lower BB, a bullish triangle will be displayed.
Skrip open-source
Dengan semangat TradingView yang sesungguhnya, pembuat skrip ini telah menjadikannya sebagai sumber terbuka, sehingga para trader dapat meninjau dan memverifikasi fungsinya. Salut untuk penulisnya! Meskipun Anda dapat menggunakannya secara gratis, perlu diingat bahwa penerbitan ulang kode ini tunduk pada Tata Tertib kami.
Pernyataan Penyangkalan
Informasi dan publikasi ini tidak dimaksudkan, dan bukan merupakan, saran atau rekomendasi keuangan, investasi, trading, atau jenis lainnya yang diberikan atau didukung oleh TradingView. Baca selengkapnya di Ketentuan Penggunaan.