OPEN-SOURCE SCRIPT
Gold Price Trend Overlay
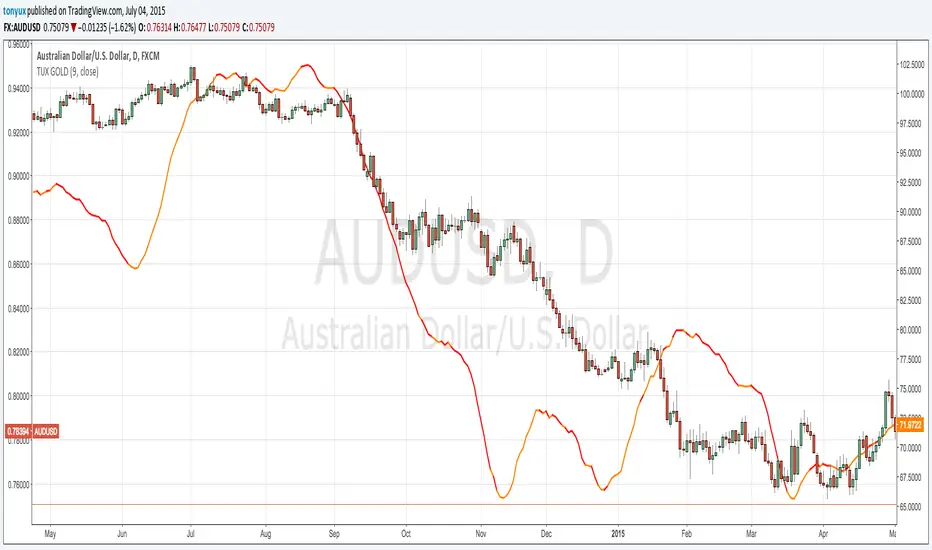
This chart overlay provides the daily 9 SMA of Gold.
If the price of GOLD is ABOVE the 9 SMA then the line will be GOLD
If the price of GOLD is BELOW the 9 SMA then the line will be RED
A good way to use this overlay is by understanding how Gold effects currency pairs.
if GOLD is BULLISH - then AUD/USD is BULLISH
if GOLD is BULLISH - then NZD/USD is BULLISH
if GOLD is BULLISH - then EUR/USD is BULLISH
if GOLD is BULLISH - then USD is bearish
if GOLD is BULLISH - then USD/CHF is BEARISH
if GOLD is BULLISH - then USD/CAD is BEARISH
Skrip open-source
Dengan semangat TradingView yang sesungguhnya, pembuat skrip ini telah menjadikannya sebagai sumber terbuka, sehingga para trader dapat meninjau dan memverifikasi fungsinya. Salut untuk penulisnya! Meskipun Anda dapat menggunakannya secara gratis, perlu diingat bahwa penerbitan ulang kode ini tunduk pada Tata Tertib kami.
Pernyataan Penyangkalan
Informasi dan publikasi ini tidak dimaksudkan, dan bukan merupakan, saran atau rekomendasi keuangan, investasi, trading, atau jenis lainnya yang diberikan atau didukung oleh TradingView. Baca selengkapnya di Ketentuan Penggunaan.