OPEN-SOURCE SCRIPT
Saturn Retrograde Periods
Saturn Retrograde Periods Visualizer for TradingView
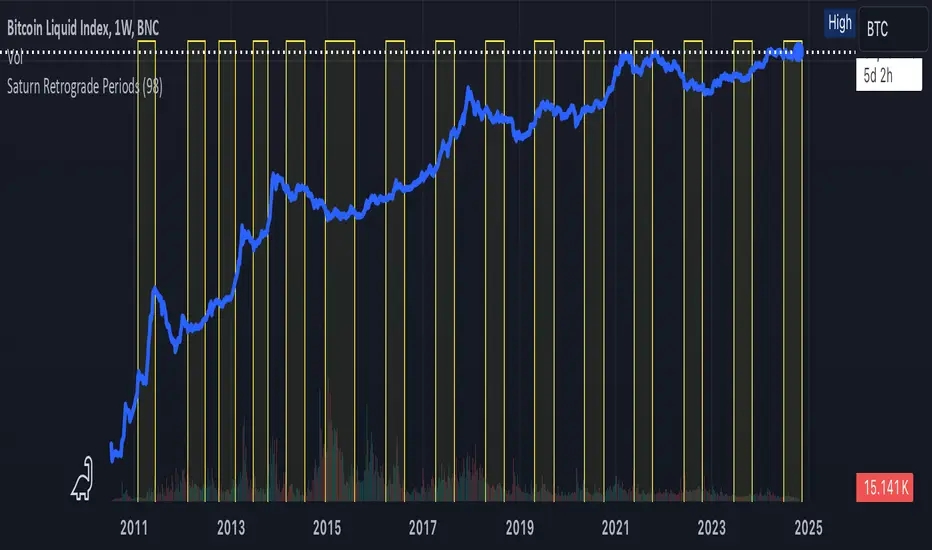
This Pine Script visualizes all Saturn retrograde periods since 2009, including the current retrograde ending on November 15, 2024. The script overlays yellow boxes on your TradingView chart to highlight the exact periods of Saturn retrograde. It's a great tool for astrologically-inclined traders or those interested in market timing based on astrological events.
Key Features:
Full Historical Coverage: Displays Saturn retrograde periods from 2009 (the inception of Bitcoin) to the current retrograde ending in November 2024.
Customizable Appearance: You can easily adjust the color and opacity of the boxes directly from the script's settings window, making it flexible for various chart styles.
Visual Clarity: The boxes span the full vertical range of your chart, ensuring the retrograde periods are clearly visible over any asset, timeframe, or price action.
How to Use:
Add the script to your TradingView chart.
Adjust the color and opacity in the settings to suit your preferences.
View all relevant Saturn retrograde periods and analyze how these astrological events may align with price movements in your selected asset.
This script is perfect for traders and analysts who want to combine astrology with financial market analysis!
scripted by chat.gpt - version 1.0
Skrip open-source
Dengan semangat TradingView yang sesungguhnya, pembuat skrip ini telah menjadikannya sebagai sumber terbuka, sehingga para trader dapat meninjau dan memverifikasi fungsinya. Salut untuk penulisnya! Meskipun Anda dapat menggunakannya secara gratis, perlu diingat bahwa penerbitan ulang kode ini tunduk pada Tata Tertib kami.
Pernyataan Penyangkalan
Informasi dan publikasi ini tidak dimaksudkan, dan bukan merupakan, saran atau rekomendasi keuangan, investasi, trading, atau jenis lainnya yang diberikan atau didukung oleh TradingView. Baca selengkapnya di Ketentuan Penggunaan.