TIME Indicator – CET (hour-based) + Bias Forecast + Alerts [EN]
What it does
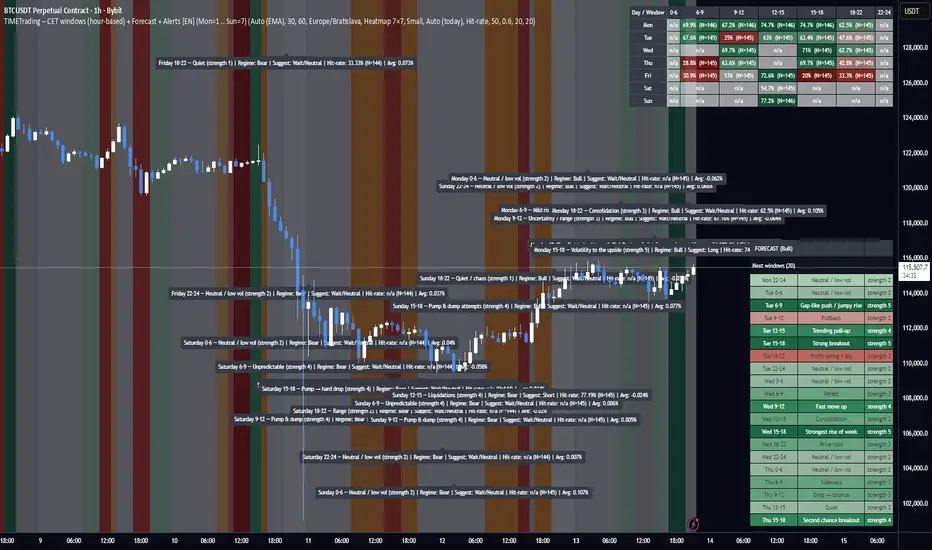
Splits each day (CET/CEST) into 7 fixed time windows: 0–6, 6–9, 9–12, 12–15, 15–18, 18–22, 22–24.
Detects market regime (Bull/Bear/Neutral) automatically from an HTF EMA (configurable), or you can set the regime manually.
Maps each day-of-week × window to an expected behavior (Bull/Bear/Neutral/Chop) with strength 1–5 (your research schedule).
Backtests on-the-fly: logs each finished window’s return to compute:
Hit-rate (directional accuracy on Bull/Bear calls)
Average % move (log-return → %)
t-stat (significance)
Observation counts N
Visualizes results via:
Heatmap 7×7 (Days × Windows) with selectable metric (Hit-rate / Avg% / t-stat)
Day (paged) table
Split 2× (long) tables to fit small screens
Forecast panel: shows the next N windows (default 8) with labels and color tint based on category + strength. Uses CET midday anchoring to avoid day-shift bugs.
Regime logic
HTF EMA (length configurable) on a selectable timeframe (HTF for regime/tfStats).
“Bull” when price > EMA (optionally EMA slope > 0); “Bear” when price < EMA (slope < 0); else “Neutral”.
Tip: for 1h charts use tfStats=240 (4h) for a stable bias; for 2h charts consider 240–360; swing traders can go 360–720.
Color language
Green shades = Bull (strength 1–5)
Red shades = Bear (1–5)
Orange = Chop (1–5)
Gray = Neutral/Range (1–5)
Optional: neutral/chop can be tinted by current regime (setting).
Alerts (3 modes)
Every window (baseline) – fires at the start of each window, always (for manual verification).
Qualified window – fires at window start only if stats meet your thresholds: Min N, Min Hit-rate.
Hourly ping (CET) – optional every-hour reminder (also mid-window).
Alert message example
Monday 6–9 — Mild rise (strength 2) | Regime: Bull | Suggest: Long
Hit-rate: 87.4% (N=215) | Avg: 0.23%
Key implementation details
Uses CET/CEST consistently. “Today” is stabilized by CET midday to prevent DOW misalignment across session boundaries.
Windows are computed from CET hour, not exchange sessions, so it’s robust across assets/timezones as long as you want CET logic.
Statistics are maintained in arrays (7×7); each completed window updates N, sum of returns, sum of squares, directional hits, etc.
Heatmap cells compute metric + color strength dynamically; you can switch the displayed metric from the input.
Inputs (most useful)
Market regime: Auto (EMA) / Bull / Bear / Neutral
EMA length (Auto), HTF for regime (minutes), Require slope
Results view: Heatmap 7×7 / Day (paged) / Split 2× (long)
Heatmap metric: Hit-rate / Avg % / t-stat
Forecast: number of upcoming windows, color opacity, tint neutral by regime
Alerts: enable baseline/qualified/hourly, thresholds Min N, Min Hit-rate
How to use
Pick your chart TF (e.g., 1h). Set HTF for regime (e.g., 240) and EMA length (e.g., 100). Keep Require slope = ON for cleaner bias.
Start on Heatmap 7×7 to spot strong day×window pockets. Then use Forecast to see what’s next today/tomorrow.
Turn on ALERT: Every window to get a message at the start of every window; optionally add Qualified for filtered calls.
In TradingView Alerts dialog choose “Any alert() function call” to receive all alert types.
Limitations / notes
This is a statistical bias tool, not a signal generator. Combine with price action, liquidity zones, vol regime, news.
Hit-rates and averages depend on your symbol/timeframe history; results differ across assets and time ranges.
EMA-based regime is HTF-closed; bias flips only after the higher-timeframe bar confirms.
Changelog snapshot (current build)
Pine v6; fixed DOW alignment via CET midday; refactored forecast (next N windows), new baseline/qualified/hourly alerts, color-tinted neutral/chop, improved table layout and text sizing.
If you want, I can also write a short “How to request access” blurb for your private/hidden publication page.
Instructions to Traders
What this tool shows
Day split (CET/CEST): 0–6, 6–9, 9–12, 12–15, 15–18, 18–22, 22–24.
For each Day × Window it displays the expected behavior (Bull/Bear/Neutral/Chop) and strength 1–5 based on historical stats.
Heatmap metrics: Hit-rate, Avg % move, or t-stat.
Quick setup
Chart TF: start on 1h (works on 30m–2h too).
HTF for regime (EMA bias):
1h chart → 240 (4h) recommended
2h chart → 240–360
Swing (4h/1D) → 360–720
EMA length: 100 (default). Keep Require slope = ON for cleaner Bull/Bear bias.
View: start with Heatmap 7×7, then try Forecast to see the next windows.
Forecast panel
Shows the next N upcoming windows (default 8), with labels and color by category + strength.
Uses CET midday anchoring to keep weekdays correct (no “day shift” at midnight).
Alerts
Enable ALERT: Every window (no filters) to get a message at the start of every window.
Optionally enable ALERT: Only when N & Hit-rate ok (filtered alerts) and ALERT: Every hour (CET) ping (hourly reminder).
In TradingView’s Create Alert dialog, select “Any alert() function call” to receive all alert types.
Alert text includes: Day + Window, regime, suggestion (Long/Short/Wait), Hit-rate, N, Avg %.
How to use the bias
Treat it as a context/expectation map, not a blind signal.
Combine with structure (HH/HL, S/R), liquidity, volatility regime, and risk management.
Stronger shades (4–5) = stronger historical tendency; still validate with live price action.
Troubleshooting
Day names wrong? Ensure Timezone = Europe/Bratislava (CET/CEST) in inputs.
“No data / n/a”: load more chart history or switch to a symbol with longer data.
Regime feels too jumpy/laggy: adjust HTF for regime and/or EMA length.
Access / contact
If this script is private and you need access, send your TradingView username with the subject “TIMETrading access”.
For support/feedback: describe your symbol, chart TF, HTF setting, and a screenshot.
Disclaimer: Statistical tendencies ≠ certainty. This is educational research, not financial advice. Always use stops and size risk responsibly.
Skrip hanya-undangan
Hanya pengguna yang disetujui oleh penulis yang dapat mengakses skrip ini. Anda perlu meminta dan mendapatkan izin untuk menggunakannya. Izin ini biasanya diberikan setelah pembayaran. Untuk detail selengkapnya, ikuti petunjuk penulis di bawah ini atau hubungi Denyzzzz secara langsung.
TradingView TIDAK menyarankan untuk membayar atau menggunakan skrip kecuali Anda sepenuhnya mempercayai pembuatnya dan memahami cara kerjanya. Anda juga dapat menemukan alternatif yang gratis dan sumber terbuka di skrip komunitas kami.
Instruksi penulis
Pernyataan Penyangkalan
Skrip hanya-undangan
Hanya pengguna yang disetujui oleh penulis yang dapat mengakses skrip ini. Anda perlu meminta dan mendapatkan izin untuk menggunakannya. Izin ini biasanya diberikan setelah pembayaran. Untuk detail selengkapnya, ikuti petunjuk penulis di bawah ini atau hubungi Denyzzzz secara langsung.
TradingView TIDAK menyarankan untuk membayar atau menggunakan skrip kecuali Anda sepenuhnya mempercayai pembuatnya dan memahami cara kerjanya. Anda juga dapat menemukan alternatif yang gratis dan sumber terbuka di skrip komunitas kami.