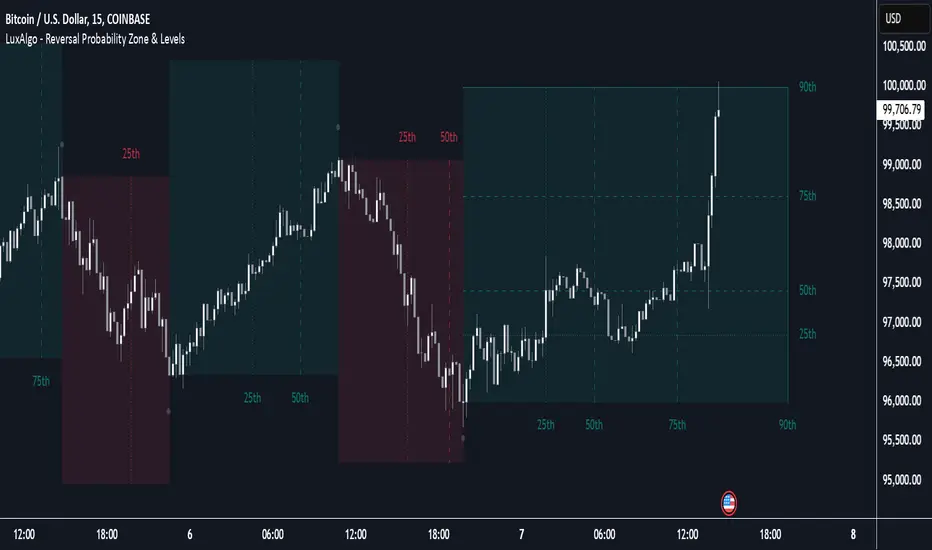
Reversal Probability Zone & Levels [LuxAlgo]The Reversal Probability Zone & Levels tool allows traders to identify a zone starting from the last detected reversal to highlight the probability of where the next reversal would be from a price and time perspective.
Price and time levels within the zone are displayed for up to 4 percentiles defined by the user.
🔶 USAGE
By default, the tool displays a zone with the 25th, 50th, 75th and 90th percentiles on both the price and time axis, indicating where, when and how many of the past reversals have occurred.
Traders can select the length for swing detection and the maximum number of reversals for probability calculations. The tool considers both bullish and bearish reversals separately, which means that if the last reversal was a swing high, the zone would show the probabilities for the last defined Maximum reversals
The Maximum reversals value has a direct impact on the probabilities, the more data traders use the more significant the result, probabilities over 10 occurrences are far weak compared to probabilities over 1000 occurrences.
🔹 Percentiles
Traders can fine-tune the percentile parameters in the settings panel.
A given percentile means that the number of occurrences in the data set is less than or equal to the percentile.
In English, this means
Percentile 20th: 20% of the occurrences are less than or equal to this value, so 80% of the occurrences are greater than this value.
Percentile 50th: 50% of the occurrences are below and 50% are above this value.
Percentile 80th: 80% of occurrences are lower than or equal to this value, so 20% of occurrences are greater than this value.
🔹 Normalize data
The Normalize Data feature allows traders to make an apples to apples comparison when we have a lot of historical data on high timeframe charts, using returns between swings instead of raw price.
🔹 Display Style
By default, the tool has the No overlapping feature enabled to display a clean chart, traders can turn it off, but this can fill the chart with too much information and barely see the price.
Traders can enable/disable settings to show only the last zone and the swing markers on the chart.
🔶 SETTINGS
Swing Length: The maximum length in bars used to identify a swing
Maximum Reversals: Maximum number of reversals included in calculations
Normalize Data: Use returns between swings instead of raw price
Percentiles: Enable/disable each of the four percentiles and select the percentile number, line style, colors, and size
🔹 Style
No Overlapping Zones: Enable or disable the No overlap between zones feature
Show Only Last Zone: Enable/disable display of last zone only
Show Marks: Enable/disable reversal markers
Indikator dan strategi
Fibonacci Cycle Finder🟩 Fibonacci Cycle Finder is an indicator designed to explore Fibonacci-based waves and cycles through visualization and experimentation, introducing a trigonometric approach to market structure analysis. Unlike traditional Fibonacci tools that rely on static horizontal levels, this indicator incorporates the dynamic nature of market cycles, using adjustable wavelength, phase, and amplitude settings to visualize the rhythm of price movements. By applying a sine function, it provides a structured way to examine Fibonacci relationships in a non-linear context.
Fibonacci Cycle Finder unifies Fibonacci principles with a wave-based method by employing adjustable parameters to align each wave with real-time price action. By default, the wave begins with minimal curvature, preserving the structural familiarity of horizontal Fibonacci retracements. By adjusting the input parameters, the wave can subtly transition from a horizontal line to a more pronounced cycle,visualizing cyclical structures within price movement. This projective structure extends potential cyclical outlines on the chart, opening deeper exploration of how Fibonacci relationships may emerge over time.
Fibonacci Cycle Finder further underscores a non-linear representation of price by illustrating how wave-based logic can uncover shifts that are missed by static retracement tools. Rather than imposing immediate oscillatory behavior, the indicator encourages a progressive approach, where the parameters may be incrementally modified to align wave structures with observed price action. This refinement process deepens the exploration of Fibonacci relationships, offering a systematic way to experiment with non-linear price dynamics. In doing so, it revisits fundamental Fibonacci concepts, demonstrating their broader adaptability beyond fixed horizontal retracements.
🌀 THEORY & CONCEPT 🌀
What if Fibonacci relationships could be visualized as dynamic waves rather than confined to fixed horizontal levels? Fibonacci Cycle Finder introduces a trigonometric approach to market structure analysis, offering a different perspective on Fibonacci-based cycles. This tool provides a way to visualize market fluctuations through cyclical wave motion, opening the door to further exploration of Fibonacci’s role in non-linear price behavior.
Traditional Fibonacci tools, such as retracements and extensions, have long been used to identify potential support and resistance levels. While valuable for analyzing price trends, these tools assume linear price movement and rely on static horizontal levels. However, market fluctuations often exhibit cyclical tendencies , where price follows natural wave-like structures rather than strictly adhering to fixed retracement points. Although Fibonacci-based tools such as arcs, fans, and time zones attempt to address these patterns, they primarily apply geometric projections. The Fibonacci Cycle Finder takes a different approach by mapping Fibonacci ratios along structured wave cycles, aligning these relationships with the natural curvature of market movement rather than forcing them onto rigid price levels.
Rather than replacing traditional Fibonacci methods, the Fibonacci Cycle Finder supplements existing Fibonacci theory by introducing an exploratory approach to price structure analysis. It encourages traders to experiment with how Fibonacci ratios interact with cyclical price structures, offering an additional layer of insight beyond static retracements and extensions. This approach allows Fibonacci levels to be examined beyond their traditional static form, providing deeper insights into market fluctuations.
📊 FIBONACCI WAVE IMPLEMENTATION 📊
The Fibonacci Cycle Finder uses two user-defined swing points, A and B, as the foundation for projecting these Fibonacci waves. It first establishes standard horizontal levels that correspond to traditional Fibonacci retracements, ensuring a baseline reference before wave adjustments are applied. By default, the wave is intentionally subtle— Wavelength is set to 1 , Amplitude is set to 1 , and Phase is set to 0 . In other words, the wave starts as “stretched out.” This allows a slow, measured start, encouraging users to refine parameters incrementally rather than producing abrupt oscillations. As these parameters are increased, the wave takes on more distinct sine and cosine characteristics, offering a flexible approach to exploring Fibonacci-based cyclicity within price action.
Three parameters control the shape of the Fibonacci wave:
1️⃣ Wavelength Controls the horizontal spacing of the wave along the time axis, determining the length of one full cycle from peak to peak (or trough to trough). In this indicator, Wavelength acts as a scaling input that adjusts how far the wave extends across time, rather than a strict mathematical “wavelength.” Lower values further stretch the wave, increasing the spacing between oscillations, while higher values compress it into a more frequent cycle. Each full cycle is divided into four quarter-cycle segments, a deliberate design choice to minimize curvature by default. This allows for subtle oscillations and smoother transitions, preventing excessive distortion while maintaining flexibility in wave projections. The wavelength is calculated relative to the A-B swing, ensuring that its scale adapts dynamically to the selected price range.
2️⃣ Amplitude Defines the vertical displacement of the wave relative to the baseline Fibonacci level. Higher values increase the height of oscillations, while lower values reduce the height, Negative values will invert the wave’s initial direction. The amplitude is dynamically applied in relation to the A-B swing direction, ensuring that an upward swing results in upward oscillations and a downward swing results in downward oscillations.
3️⃣ Phase Shifts the wave’s starting position along its cycle, adjusting alignment relative to the swing points. A phase of 0 aligns with a sine wave, where the cycle starts at zero and rises. A phase of 25 aligns with a cosine wave, starting at a peak and descending. A phase of 50 inverts the sine wave, beginning at zero but falling first, while a phase of 75 aligns with an inverted cosine , starting at a trough and rising. Intermediate values between these phases create gradual shifts in wave positioning, allowing for finer alignment with observed market structures.
By fine-tuning these parameters, users can adapt Fibonacci waves to better reflect observed market behaviors. The wave structure integrates with price movements rather than simply overlaying static levels, allowing for a more dynamic representation of cyclical price tendencies. This indicator serves as an exploratory tool for understanding potential market rhythms, encouraging traders to test and visualize how Fibonacci principles extend beyond their traditional applications.
🖼️ CHART EXAMPLES 🖼️
Following this downtrend, price interacts with curved Fibonacci levels, highlighting resistance at the 0.236 and 0.382 levels, where price stalls before pulling back. Support emerges at the 0.5, 0.618, and 0.786 levels, where price finds stability and rebounds
In this Fibonacci retracement, price initially finds support at the 1.0 level, following the natural curvature of the cycle. Resistance forms at 0.786, leading to a pullback before price breaks through and tests 0.618 as resistance. Once 0.618 is breached, price moves upward to test 0.5, illustrating how Fibonacci-based cycles may align with evolving market structure beyond static, horizontal retracements.
Following this uptrend, price retraces downward and interacts with the Fibonacci levels, demonstrating both support and resistance at key levels such as 0.236, 0.382, 0.5, and 0.618.
With only the 0.5 and 1.0 levels enabled, this chart remains uncluttered while still highlighting key price interactions. The short cycle length results in a mild curvature, aligning smoothly with market movement. Price finds resistance at the 0.5 level while showing strong support at 1.0, which follows the natural flow of the market. Keeping the focus on fewer levels helps maintain clarity while still capturing how price reacts within the cycle.
🛠️ CONFIGURATION AND SETTINGS 🛠️
Wave Parameters
Wavelength : Stretches or compresses the wave along the time axis, determining the length of one full cycle. Higher values extend the wave across more bars, while lower values compress it into a shorter time frame.
Amplitude : Expands or contracts the wave along the price axis, determining the height of oscillations relative to Fibonacci levels. Higher values increase the vertical range, while negative values invert the wave’s initial direction.
Phase : Offsets the wave along the time axis, adjusting where the cycle begins. Higher values shift the starting position forward within the wave pattern.
Fibonacci Levels
Levels : Enable or disable specific Fibonacci levels (0.0, 0.236, 0.382, 0.5, 0.618, 0.786, 1.0) to focus on relevant price zones.
Color : Modify level colors for enhanced visual clarity.
Visibility
Trend Line/Color : Toggle and customize the trend line connecting swing points A and B.
Setup Lines : Show or hide lines linking Fibonacci levels to projected waves.
A/B Labels Visibility : Control the visibility of swing point labels.
Left/Right Labels : Manage the display of Fibonacci level labels on both sides of the chart.
Fill % : Adjust shading intensity between Fibonacci levels (0% = no fill, 100% = maximum fill).
A and B Points (Time/Price):
These user-defined anchor points serve as the basis for Fibonacci wave calculations and can be manually set. A and B points can also be adjusted directly on the chart, with automatic synchronization to the settings panel, allowing for seamless modifications without needing to manually input values.
⚠️ DISCLAIMER ⚠️
The Fibonacci Cycle Finder is a visual analysis tool designed to illustrate Fibonacci relationships and serve as a supplement to traditional Fibonacci tools. While the indicator employs mathematical and geometric principles, no guarantee is made that its calculations will align with other Fibonacci tools or proprietary methods. Like all technical and visual indicators, the Fibonacci levels generated by this tool may appear to visually align with key price zones in hindsight. However, these levels are not intended as standalone signals for trading decisions. This indicator is intended for educational and analytical purposes, complementing other tools and methods of market analysis.
🧠 BEYOND THE CODE 🧠
Fibonacci Cycle Finder is the latest indicator in the Fibonacci Geometry Series. Building on the concepts of the Fibonacci Time-Price Zones and the Fibonacci 3-D indicators, this tool introduces a trigonometric approach to market structure analysis.
The Fibonacci Cycle Finder indicator, like other xxattaxx indicators , is designed to encourage both education and community engagement. Your feedback and insights are invaluable to refining and enhancing the Fibonacci Cycle Finder indicator. We look forward to the creative applications, observations, and discussions this tool inspires within the trading community.

Money Moves [MDR PLAY Premium Algo V2]As my previous post of this indicator was hidden for some rules I didn`t read, I publish it once again... This indicator show you entry, point, SL, TP and cloud.Adjust it , enjoy it. Till the end of moth, this will be free .

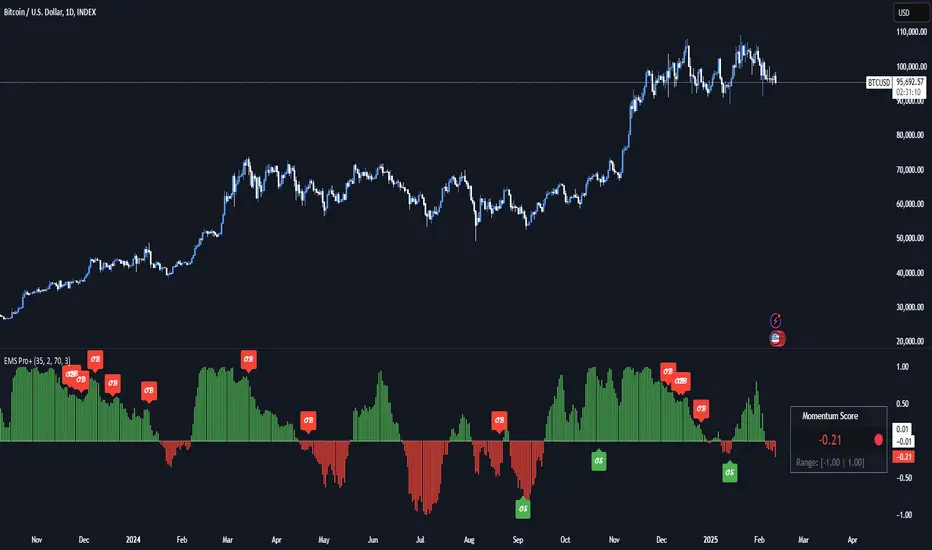
Enhanced Momentum Divergence Radar+ [Alpha Extract]Enhanced Momentum Divergence Radar+
The AE's Enhanced Momentum Divergence Radar+ is designed to detect momentum shifts and divergence patterns, helping traders identify potential trend reversals and continuation points. By normalizing momentum readings and applying divergence detection, it enhances market timing for entries and exits.
🔶 CALCULATION
The indicator calculates normalized momentum using a combination of Detrended Price Oscillator (DPO) and volatility-adjusted smoothing techniques. It highlights overbought and oversold conditions while identifying bullish and bearish divergences.
Core Calculation:
ATR-based volatility adjustment ensures dynamic sensitivity.
DPO is derived from the price minus a simple moving average (SMA) to isolate cyclical movements.
Momentum score is normalized using historical max values for consistent scaling.
Thresholds are dynamically adjusted based on average absolute momentum.
dpo = close - ma
sd = (dpo / volatility) * 100
normalizedSD = sd / maxAbsSD
The momentum score is plotted as a histogram, where:
Green bars indicate strong upward momentum.
Red bars indicate strong downward momentum.
Neutral values fade into gray.
🔶 DETAILS
📊 Visual Features:
Histogram bars dynamically color-coded based on momentum strength.
Threshold bands provide reference points for overbought and oversold levels.
Divergence markers (Bullish/Bearish & Hidden Bullish/Bearish) highlight key reversal signals.
🛠 How Divergences Work:
Bullish Divergence (𝓞𝓢): Price makes a lower low while momentum makes a higher low.
Bearish Divergence (𝓞𝓑): Price makes a higher high while momentum makes a lower high.
Hidden Divergences confirm trend continuations rather than reversals.
📌 Example of Divergence Logic:
bullishDiv = (low == priceLow) and (sd > momentumLow)
bearishDiv = (high == priceHigh) and (sd < momentumHigh)
🔶 EXAMPLES
📍 The chart below illustrates price reacting to momentum divergences, identifying potential tops and bottoms before major price moves.
📌 Example snapshots:
A bullish divergence leading to a reversal in price.
A bearish divergence marking the beginning of a downtrend.
🔶 SETTINGS
🔹 Customization Options:
Lookback Period: Adjusts sensitivity to market cycles.
Smoothing Period: Controls signal clarity.
Color Options: Enables bar coloring based on momentum strength.
Divergence Sensitivity: Choose to display hidden divergences.
RK Master BUY/ SELL & TPThis indicator is based Moving average based on the ranges.
This indicator provide the Buy and Sell signals with Take Profit.
Open a trade Buy / Sell signal and close the position at Take Profit signal.

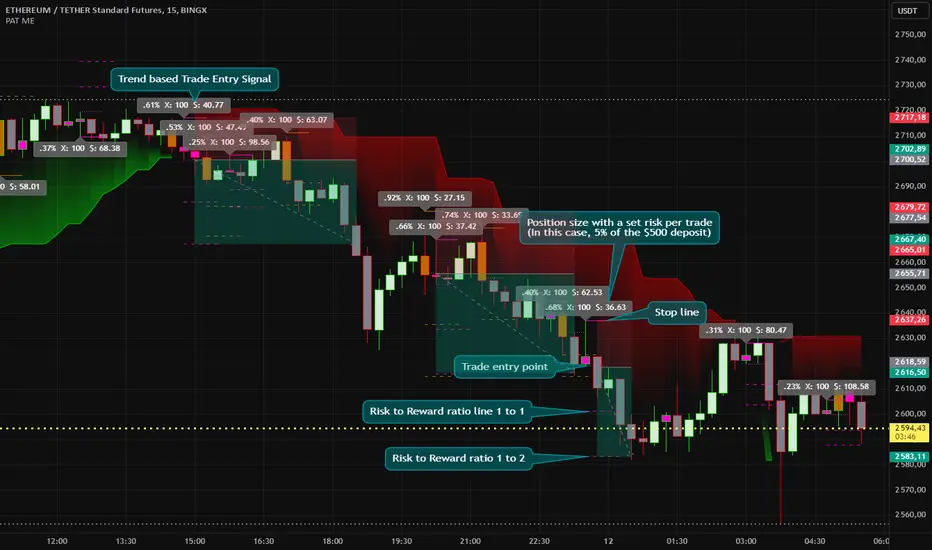
Price Action Trend and Margin EquityThe Price Action Trend and Margin Equity indicator is a multifunctional market analysis tool that combines elements of money management and price pattern analysis. The indicator helps traders identify key price action patterns and determine optimal entry, exit and stop loss levels based on the current trend.
The main components of the indicator:
Money Management:
Allows the trader to set risk management parameters such as the percentage of possible loss on the position, the use of fixed leverage and the total capital.
Calculates the required leverage level to achieve a specified percentage of loss.
Price Action:
Correctly identifies various price patterns such as Pin Bar, Engulfing Bar, PPR Bar and Inside Bar.
Displays these patterns on the chart with the ability to customize candle colors and display styles.
Allows the trader to customize take profit and stop loss points to display them on the chart.
The ability to display patterns only in the direction of the trend.
Trend: (some code taken from ChartPrime)
Uses a trend cloud to visualize the current market direction.
The trend cloud is displayed on the chart and helps traders determine whether the market is in an uptrend or a downtrend.
Alert:
Allows you to set an alert that will be triggered when the pattern is formed.
Example of use:
Let's say a trader uses the indicator to trade the crypto market. He sets the money management parameters, setting the maximum loss per position to 5% and using a fixed leverage of 1:100. The indicator automatically calculates the required position size to meet these parameters ($: on the label). Or displays the leverage (X: on the label) to achieve the required risk.
The trader receives an alert when a Pin Bar is formed. The indicator displays the entry, exit, and stop loss levels based on this pattern. The trader opens a position for the recommended amount in the direction indicated by the indicator and sets the stop loss and take profit at the recommended levels.
General Settings:
Position Loss Percentage: Sets the maximum loss percentage you are willing to take on a single position.
Use Fixed Leverage: Enables or disables the use of fixed leverage.
Fixed Leverage: Sets the fixed leverage level.
Total Equity: Specifies the total equity you are using for trading. (Required for calculation when using fixed leverage)
Turn Patterns On/Off: You can turn on or off the display of various price patterns such as Pin Bar, Outside Bar (Engulfing), Inside Bar, and PPR Bar.
Pattern Colors: Sets the colors for displaying each pattern on the chart.
Candle Color: Allows you to set a neutral color for candles that do not match the price action.
Show Lines: Allows you to turn on or off the display of labels and lines.
Line Length: Sets the length of the stop, entry, and take profit lines.
Label color: One color for all labels (configured below) or the color of the labels in the color of the candle pattern.
Pin entry: Select the entry point for the pin bar: candle head, bar close, or 50% of the candle.
Coefficients for stop and take lines.
Use trend for price action: When enabled, will show price action signals only in the direction of the trend.
Display trend cloud: Enables or disables the display of the trend cloud.
Cloud calculation period: Sets the period for which the maximum and minimum values for the cloud are calculated. The longer the period, the smoother the cloud will be.
Cloud colors: Sets the colors for uptrends and downtrends, as well as the transparency of the cloud.
The logic of the indicator:
Pin Bar is a candle with a long upper or lower shadow and a short body.
Logic: If the length of one shadow is twice the body and the opposite shadow of the candle, it is considered a Pin Bar.
An Inside Bar is a candle that is completely engulfed by the previous candle.
Logic: If the high and low of the current candle are inside the previous candle, it is an Inside Bar.
An Outside Bar or Engulfing is a candle that completely engulfs the previous candle.
Logic: If the high and low of the current candle are outside the previous candle and close outside the previous candle, it is an Outside Bar.
A PPR Bar is a candle that closes above or below the previous candle.
Logic: If the current candle closes above the high of the previous candle or below its low, it is a PPR Bar.
Stop Loss Levels: Calculated based on the specified ratios. If set to 1.0, it shows the correct stop for the pattern by pushing away from the entry point.
Take Profit Levels: Calculated based on the specified ratios.
Create a Label: The label is created at the stop loss level and contains information about the potential leverage and loss.
The formula for calculating the $ value is:
=(Total Capital x (Maximum Loss Percentage on Position/100)) / (Difference between Entry Level and Stop Loss Level × Ratio that sets the stop loss level relative to the length of the candlestick shadow × Fixed Leverage Value) .
Labels contain the following information:
The percentage of price change from the recommended entry point to the stop loss level.
Required Leverage (X: ): The amount of leverage required to achieve the specified loss percentage. (Or a fixed value if selected).
Required Capital ($: ): The amount of capital required to open a position with the specified leverage and loss percentage (only displayed when using fixed leverage).
The trend cloud identifies the maximum and minimum price values for the specified period.
The cloud value is set depending on whether the current price is equal to the high or low values.
If the current closing price is equal to the high value, the cloud is set at the low value, and vice versa.
RU
Индикатор "Price Action Trend and Margin Equity" представляет собой многофункциональный инструмент для анализа рынка, объединяющий в себе элементы управления капиталом и анализа ценовых паттернов. Индикатор помогает трейдерам идентифицировать ключевые прайс экшн паттерны и определять оптимальные уровни входа, выхода и стоп-лосс на основе текущего тренда.
Основные компоненты индикатора:
Управление капиталом:
Позволяет трейдеру задавать параметры управления рисками, такие как процент возможного убытка по позиции, использование фиксированного плеча и общий капитал.
Рассчитывает необходимый уровень плеча для достижения заданного процента убытка.
Price Action:
Правильно идентифицирует различные ценовые паттерны, такие как Pin Bar, Поглащение Бар, PPR Bar и Внутренний Бар.
Отображает эти паттерны на графике с возможностью настройки цветов свечей и стилей отображения.
Позволяет трейдеру настраивать точки тейк профита и стоп лосса для отображения их на графике.
Возможность отображения паттернов только в натправлении тренда.
Trend: (часть кода взята у ChartPrime)
Использует облако тренда для визуализации текущего направления рынка.
Облако тренда отображается на графике и помогает трейдерам определить, находится ли рынок в восходящем или нисходящем тренде.
Оповещение:
Дает возможность установить оповещение которое будет срабатывать при формировании паттерна.
Пример применения:
Предположим, трейдер использует индикатор для торговли на крипто рынке. Он настраивает параметры управления капиталом, устанавливая максимальный убыток по позиции в 5% и используя фиксированное плечо 1:100. Индикатор автоматически рассчитывает необходимый объем позиции для соблюдения этих параметров ($: на лейбле). Или отображает плечо (Х: на лейбле) для достижения необходимого риска.
Трейдер получает оповещение о формировании Pin Bar. Индикатор отображает уровни входа, выхода и стоп-лосс, основанные на этом паттерне. Трейдер открывает позицию на рекомендуемую сумму в направлении, указанном индикатором, и устанавливает стоп-лосс и тейк-профит на рекомендованных уровнях.
Общие настройки:
Процент убытка по позиции: Устанавливает максимальный процент убытка, который вы готовы понести по одной позиции.
Использовать фиксированное плечо: Включает или отключает использование фиксированного плеча.
Уровень фиксированного плеча: Задает уровень фиксированного плеча.
Общий капитал: Указывает общий капитал, который вы используете для торговли. (Необходим для расчета при использовании фиксированного плеча)
Включение/отключение паттернов: Вы можете включить или отключить отображение различных ценовых паттернов, таких как Pin Bar, Outside Bar (Поглощение), Inside Bar и PPR Bar.
Цвета паттернов: Задает цвета для отображения каждого паттерна на графике.
Цвет свечей: Позволяет задать нейтральный цвет для свечей неподходящих под прйс экшн.
Показывать линии: Позволяет включить или отключить отображение лейблов и линий.
Длинна линий: Настройка длинны линий стопа, линии входа и тейк профита.
Цвет лейбла: Один цвет для всех лейблов (настраивается ниже) или цвет лейблов в цвет паттерна свечи.
Вход в пин: Выбор точки входа для пин бара: голова свечи, точка закрытия бара или 50% свечи.
Коэффиценты для стоп и тейк линий.
Использовать тренд для прайс экшна: При включении будет показывать прайс экшн сигналы только в направлении тренда.
Отображение облака тренда: Включает или отключает отображение облака тренда.
Период расчета облака: Устанавливает период, за который рассчитываются максимальные и минимальные значения для облака. Чем больше период, тем более сглаженным будет облако.
Цвета облака: Задает цвета для восходящего и нисходящего трендов, а также прозрачность облака.
Логика работы индикатора:
Pin Bar — это свеча с длинной верхней или нижней тенью и коротким телом.
Логика: Если длина одной тени вдвое больше тела и противоположной тени свечи, считается, что это Pin Bar.
Inside Bar — это свеча, полностью поглощенная предыдущей свечой.
Логика: Если максимум и минимум текущей свечи находятся внутри предыдущей свечи, это Inside Bar.
Outside Bar или Поглощение — это свеча, которая полностью поглощает предыдущую свечу.
Логика: Если максимум и минимум текущей свечи выходят за пределы предыдущей свечи и закрывается за пределами предыдущей свечи, это Outside Bar.
PPR Bar — это свеча, которая закрывается выше или ниже предыдущей свечи.
Логика: Если текущая свеча закрывается выше максимума предыдущей свечи или ниже ее минимума, это PPR Bar.
Уровни стоп-лосс: Рассчитываются на основе заданных коэффициентов. При значении 1.0 показывает правильный стоп для паттерна отталкиваясь от точки входа.
Уровки тейк-профита: Рассчитываются на основе заданных коэффициентов.
Создание метки: Метка создается на уровне стоп-лосс и содержит информацию о потенциальном плече и убытке.
Формула для вычисления значения $:
=(Общий капитал x (Максимальный процент убытка по позиции/100)) / (Разница между уровнем входа и уровнем стоп-лосс × Коэффициент, задающий уровень стоп-лосс относительно длины тени свечи × Значение фиксированного плеча).
Метки содержат следующую информацию:
Процент изменения цены от рекомендованной точки входа до уровня стоп-лосс.
Необходимое плечо (Х: ): Уровень плеча, необходимый для достижения заданного процента убытка. (Или фиксированное значение если оно выбрано).
Необходимый капитал ($: ): Сумма капитала, необходимая для открытия позиции с заданным плечом и процентом убытка (отображается только при использовании фиксированного плеча).
Облако тренда определяет максимальные и минимальные значения цены за указанный период.
Значение облака устанавливается в зависимости от того, совпадает ли текущая цена с максимальными или минимальными значениями.
Если текущая цена закрытия равна максимальному значению, облако устанавливается на уровне минимального значения, и наоборот.
MTF Screener With Buy and SellVery similar to the Enhanced Pressure MTF Screener, but blended in some of the B-Xtrender data, and a row at the top that indicates when the trend changes, the time, and the price.

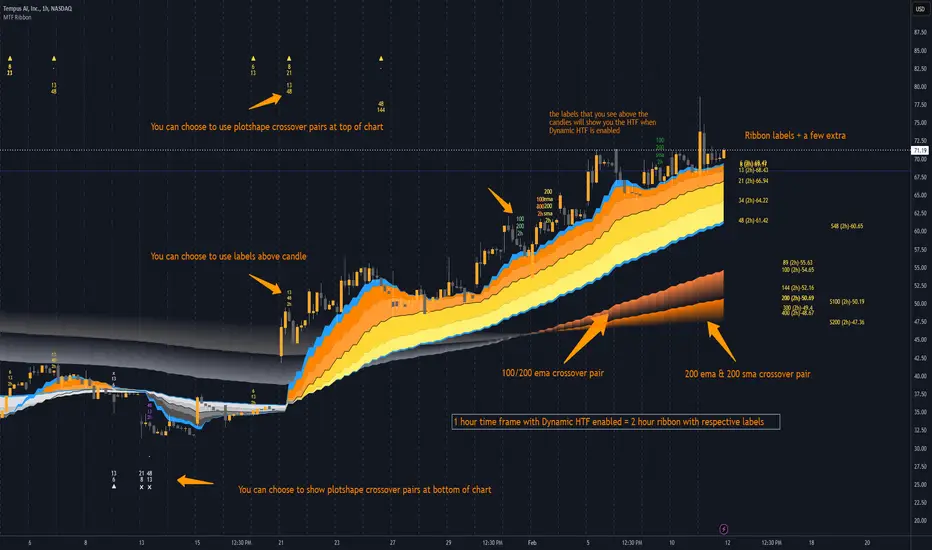
EMA/SMA Ribbon Pro (AUTO HTF + Labels)This indicator is a multi-timeframe (MTF) moving average ribbon that dynamically adjusts to the next highest timeframe. It provides a visual representation of market trends by stacking multiple EMAs and SMAs with customizable color fills and labels.
Features
✅ Multi-Timeframe (MTF) Support: Automatically detects the next highest time frame or allows for manual selection
✅ Customizable Moving Averages: Supports EMA and SMA with different lengths for flexible configuration
✅ Ribbon Visualization: Smooth color transitions between different moving averages for better trend identification
✅ Crossover Labels: Detects bullish and bearish EMA/SMA crossovers and marks them on the chart
✅ Price Labels & Timeframe Display: Displays moving average values to the right of the price axis with customizable label padding and colors
How It Works
Select the HTF mode: Manual or automatic
Choose EMA/SMA lengths to create different ribbons
Enable/disable price labels for each moving average
Customize colors and transparency for ribbons and labels
Crossover labels appear when faster moving averages cross slower ones and vice versa
Use Cases
📌 Trend Identification: Identify bullish and bearish trends using multiple EMAs and SMAs
📌 Support & Resistance Zones: MAs can act as dynamic support and resistance levels
📌 Reversal & Confirmation Signals: Watch for MTF crossovers to confirm trend changes
Customization
🔹 Standard EMA Lengths: 6, 8, 13, 21, 34, 48, 100, 200, 300, 400
🔹 SMA Lengths: 48, 100, 200
🔹 Color Adjustments: Set custom colors for bullish/bearish ribbons
🔹 Crossovers: Enable/disable custom crossover pairs (e.g., 100/200 EMA, 200 EMA/SMA).
This indicator is perfect for traders who rely on multi-timeframe confluence while seeking to enhance their market analysis and decision-making process.
As always, by combining EMA/SMA Ribbon with other tools, traders ensure that they are not relying on a single indicator. This layered approach can reduce the likelihood of false signals and improve overall trading accuracy.
As always, be sure to use any indicator with price action and volume indicators for better trade confirmation!
Abhi Nifty Option Scalping ABHI SuperTrend + VWAP + PSAR + VWMA + MACD Indicator+48 EMA Channel
Description:
This powerful multi-indicator script combines several technical analysis tools to help traders make informed decisions. It includes:
✅ SuperTrend: Identifies uptrends and downtrends, with Buy/Sell signals.
✅ EMA Chanel
✅ VWAP (Volume Weighted Average Price): Helps determine fair price levels based on volume.
✅ PSAR (Parabolic SAR): Assists in detecting trend reversals.
✅ VWMA (Volume Weighted Moving Average): A 20-period VWMA for trend confirmation.
✅ High Volume Detection: Highlights bars with unusually high volume.
✅ MACD (Moving Average Convergence Divergence): Includes histogram and signal line for momentum analysis.
✅ Elder Impulse System: Colors bars based on trend strength and momentum.
✅ Alerts: SuperTrend Buy/Sell alerts and trend direction changes.
🔹 Ideal for: Swing traders, intraday traders, and trend-following strategies.
🔹 Customizable Inputs: Adjust ATR period, multipliers, and other parameters to fit your trading style.
📌 How to Use:
Look for SuperTrend Buy/Sell signals as trend confirmations.
Use VWAP and VWMA for dynamic support/resistance levels.
Combine MACD and Elder Impulse to gauge momentum strength.
PSAR dots indicate potential trend reversals.
High volume bars signal increased market participation.
🚀 Best Used With: Support/Resistance zones, Price Action, and Risk Management Strategies.

Pivot Point с зигзагом и Фибоначчи [DaVinchi]Название:
Supertrend Zone Pivot Point с зигзагом и Фибоначчи (RU) с выбором таймфрейма
Описание:
Данный индикатор объединяет в себе несколько популярных инструментов технического анализа, позволяющих получить комплексное представление о тренде, определить ключевые точки разворота, а также выявить важные уровни поддержки и сопротивления с помощью Фибоначчи. Индикатор отображается поверх графика и работает на выбранном таймфрейме, что дает возможность проводить многовременной анализ.
Основные компоненты и функциональность:
Supertrend и Premium/Discount Zone:
Supertrend:
Индикатор рассчитывает линию Supertrend на основе выбранного периода ATR и множителя (factor). Эта линия помогает определить направление тренда:
При нахождении цены выше линии – тренд считается восходящим (отображается с настраиваемым зелёным цветом).
При нахождении цены ниже линии – тренд считается нисходящим (отображается с настраиваемым красным цветом).
Премиум/Дискаунт:
Дополнительно можно отобразить линии премиум/дискаунт, которые вычисляются как отступ от линии Supertrend на основе дополнительного множителя ATR (atrline). Эти линии помогают оценить зону перекупленности или перепроданности по отношению к Supertrend.
Пивоты и Зигзаг:
При изменении направления Supertrend (определяемом по смене знака изменения) происходит фиксация экстремальных значений – пивотов максимум (при смене на нисходящий тренд) и пивотов минимум (при смене на восходящий тренд).
На уровне каждого пивота создаются метки (labels) с указанием цены, а также проводятся линии, соединяющие предыдущие и текущие экстремумы, формируя зигзаг.
Отображение зигзага можно включать или отключать в настройках, а его цвет, толщина и стиль (сплошная, пунктирная или штриховая линия) задаются пользователем.
Уровни Фибоначчи:
На основе последних найденных пивотов (максимум и минимум) определяется диапазон, по которому рассчитываются уровни Фибоначчи. Если пивоты не обнаружены, используются экстремумы за последние 50 баров.
Строятся линии Фибоначчи с уровнями 0.0, 0.236, 0.382, 0.5, 0.618 и 1.0. Для каждого уровня можно задать:
Возможность отображения (вкл./выкл.).
Значение уровня, цвет, толщину и стиль линии.
Смещение линии (в барах) и направление смещения (влево или вправо).
Рядом с каждой линией выводится метка с указанием названия уровня, цены и процентного соотношения, что помогает быстро оценить, где располагаются потенциальные уровни поддержки или сопротивления.
Выбор таймфрейма и входные данные:
Все расчёты (цены открытия, максимума, минимума, закрытия, ATR и Supertrend) осуществляются на основе данных выбранного таймфрейма. Это позволяет применять индикатор для анализа как краткосрочных, так и долгосрочных графиков.
Пользователь задаёт основные параметры: период ATR, множитель для расчёта Supertrend, множитель для линии премиум/дискаунт и сам таймфрейм.
Настраиваемость и визуальные параметры:
Отображение: Возможность включать или отключать отдельные элементы: зигзаг, линию Supertrend, линию премиум/дискаунт, уровни Фибоначчи.
Настройки внешнего вида:
Для зигзага: цвет, толщина и стиль линии.
Для Supertrend: цвета линий для восходящего и нисходящего трендов, толщина линии, а также полупрозрачное залитие между линией и серединой тела свечи.
Для пивотов: цвета текста и фона меток, а также цвета и толщина линий, соединяющих пивоты.
Для Фибоначчи: индивидуальные настройки для каждого уровня (цвет, толщина, стиль линии), а также смещение и направление вывода линий и меток.
Преимущества и применение:
Комплексный анализ тренда: Сочетание Supertrend с пивотами и зигзагом позволяет не только определить общее направление движения цены, но и зафиксировать ключевые точки разворота.
Определение уровней поддержки/сопротивления: Построенные уровни Фибоначчи помогают выявить зоны, где цена может отскочить или пробить уровень, что является важным для постановки стоп-лоссов и тейк-профитов.
Гибкая настройка: Большое количество входных параметров позволяет адаптировать индикатор под различные торговые стратегии и личные предпочтения трейдера.
Многовременной анализ: Возможность выбора таймфрейма делает индикатор универсальным для анализа как краткосрочных, так и долгосрочных трендов.
Как использовать:
Установите необходимые параметры (ATR, множители, таймфрейм, цвета и стили линий) в настройках индикатора.
Включите отображение нужных элементов (например, зигзаг, Supertrend, уровни Фибоначчи) в зависимости от вашей торговой стратегии.
Используйте линию Supertrend для определения направления тренда, а пивоты и зигзаг для выявления точек разворота.
Анализируйте уровни Фибоначчи для поиска потенциальных зон поддержки и сопротивления, где цена может замедлить движение или развернуться.

Floki PoleThe Floki Pole is a custom oscillator designed to provide clear buy and sell signals using a smoothed two-pole filter. Inspired by the concept of smooth market oscillations, it uses historical price data to generate precise entry and exit points.
Key Features:
Two-Pole Filter: A smoothing technique is applied to the price data, filtering out noise while retaining important trends.
Buy and Sell Signals:
A Buy Signal is generated when the oscillator crosses above a historical value and remains below zero.
A Sell Signal is generated when the oscillator crosses below a historical value and remains above zero.
Signal Precision: The indicator identifies precise crossover points, giving traders clearer entry/exit signals.
Previous Signals: Historical buy and sell signals are plotted as lines, showing past entries and exits to give context to current market conditions.
Color-Coded Oscillator:
The oscillator itself is color-coded based on market trends:
Green for an uptrend (buy signals).
Red for a downtrend (sell signals).
How It Works:
The Floki Pole works by applying a two-pole filter to a normalized version of the price data (the difference between the current price and its moving average). This results in a smoothed version of the market movement, which helps highlight significant trend reversals.
When the oscillator crosses a specific threshold (either moving above or below the signal line), it triggers a buy or sell signal, which is visually marked on the chart.
The previous buy and sell signals are retained and shown as lines, allowing traders to observe past performance and trends, aiding decision-making.
Ideal Use:
The Floki Pole is suited for traders looking for a more precise entry and exit mechanism based on trend changes.
It can be combined with other indicators like moving averages, RSI, or Bollinger Bands for enhanced analysis.
Benefits:
Clear Trend Identification: Quickly identifies when market trends are shifting, helping traders stay aligned with the dominant market direction.
Historical Context: By displaying previous signals, it helps traders see how the market behaved at specific points in time.
Customizable: The indicator allows you to fine-tune the smoothing and filtering parameters to better suit different market conditions.

HADC Indicator with Buy/Hold/Sell - AK//@version=5
indicator("HADC Indicator with Buy/Hold/Sell", overlay=true)
// Heikin Ashi Candle Calculation
ha_close = (open + high + low + close) / 4
var float ha_open = na
ha_open := na(ha_open ) ? (open + close) / 2 : (ha_open + ha_close ) / 2
ha_high = math.max(high, math.max(ha_close, ha_open))
ha_low = math.min(low, math.min(ha_close, ha_open))
// Trend Direction
ha_trend = ha_close > ha_open ? 1 : -1
trend_change = ha_trend != ha_trend
// Buy, Sell, and Hold Signals
buy_signal = trend_change and ha_trend == 1
sell_signal = trend_change and ha_trend == -1
hold_signal = not trend_change // HOLD when there's no trend change
// Label Positioning
label_position_buy = low - ta.atr(14) * 0.5
label_position_sell = high + ta.atr(14) * 0.5
label_position_hold = (high + low) / 2 // HOLD appears in the middle
// Plot Labels
if buy_signal
label.new(x=bar_index, y=label_position_buy, text="BUY", color=color.rgb(76, 175, 79, 100), textcolor=color.white, size=size.small, style=label.style_label_down)
if sell_signal
label.new(x=bar_index, y=label_position_sell, text="SELL", color=color.rgb(255, 82, 82, 100), textcolor=color.white, size=size.small, style=label.style_label_up)
if hold_signal
label.new(x=bar_index, y=label_position_hold, text="HOLD", color=color.rgb(6, 6, 6, 100), textcolor=color.white, size=size.small, style=label.style_label_up)
// Plot Heikin Ashi Candles
plotcandle(ha_open, ha_high, ha_low, ha_close, title="Heikin Ashi", color=ha_trend == 1 ? color.green : color.red)

DeepSeek Medium - Gaussian Channel Strategy v3.0Large interval from 1h to 1D. On the Gaussian Channel indicator, DeepSeek generated a strategy.

A+ indicatorDescription of Your Script: Institutional Liquidity & Order Block Strategy
Your script is a Smart Money Concept (SMC) trading indicator designed to identify high-probability trade setups using:
Market Structure Shifts (Break of Structure & Change of Character - BOS & ChoCh)
Liquidity Grabs (Sweeping Equal Highs/Lows)
Order Blocks (Institutional Entry Points)

𝓜𝓐 𝓢𝓶𝓸𝓸𝓽𝓱𝓮𝓭 𝓡𝓢𝓘 𝓕𝓸𝓻 𝓛𝓸𝓸𝓹MA Smoothed Source For RSI Loop | Crypto_Mercenary_
Conceptual Foundation and Innovation
The "MA Smoothed Source For RSI Loop" indicator developed by Crypto_Mercenary_ innovates by smoothing the source data used for RSI calculation with various moving averages before feeding it into a for-loop scoring system. Rather than smoothing the RSI itself, this approach focuses on pre-processing the price data to reduce noise, thereby providing a cleaner input for RSI computation. The for-loop then evaluates this smoothed RSI to generate momentum signals, offering traders a refined method for detecting market trends and potential reversals.
Technical Composition and Calculation
The indicator's functionality is divided into two main parts:
Source Smoothing: Before calculating RSI, the source data (typically close price) is smoothed using one of several moving averages (EMA, SMA, WMA, VWMA, HMA, RMA, DEMA, or none) as selected by the user. This smoothing aims to filter out short-term volatility, providing a more consistent base for RSI calculation.
RSI Calculation and For-Loop Scoring:
RSI: Calculated using the smoothed source data over a user-defined length.
For-Loop Mechanism: A loop runs from a to b, comparing the current RSI value with past values of this smoothed RSI. A score (counter) is generated, which increases or decreases based on whether the current RSI exceeds or falls below past values. If the weighted option is activated, this comparison gives more weight to recent data points, adjusting the score accordingly.
The final score is then potentially normalized for better interpretation, compared against thresholds to determine market momentum signals.
Features and User Inputs
This indicator is highly customizable, allowing traders to tailor its behavior:
Weighted Calculation: Option to adjust scoring to favor recent price action.
RSI Length: Sets the period for RSI calculation.
Source: The price data to be smoothed before RSI calculation, default is close.
MA Type: Choice from various moving averages to smooth the source data.
Smooth Length: Length of the moving average used for smoothing.
For Loop Range: Defines the historical range (a to b) for the scoring loop.
Thresholds: Custom thresholds to define when signals for uptrends or downtrends are generated.
Practical Applications
This indicator is particularly beneficial for:
Identifying Momentum Shifts: The scoring system helps in detecting potential changes in market momentum.
Noise Reduction: By smoothing the source data, it aims to provide more reliable RSI signals in volatile markets.
Trend Analysis: Assists in confirming or challenging the current market trend based on the smoothed RSI's performance.
Advantages and Strategic Value
The "MA Smoothed Source For RSI Loop" offers an advantage by focusing on cleaning the input data for RSI, which can lead to more accurate momentum readings. Its flexibility in configuration allows traders to adapt the indicator to different market conditions or asset volatilities, enhancing its strategic value in trading decisions.
Alerts and Visual Cues
Visual Signals: The indicator plots the loop score, with colors indicating uptrends (gold) or downtrends (blue). Horizontal lines at thresholds and shaded areas between them provide visual aids for trend analysis.
**No explicit alerts in the script, but users can set up custom alerts based on the signals.
Summary and Usage Tips
The "MA Smoothed Source For RSI Loop | Crypto_Mercenary_" provides a nuanced approach to RSI by smoothing the price data before its calculation, resulting in potentially more reliable signals. Traders can use this indicator to gain a clearer picture of market momentum, adjusting parameters to fit different market behaviors or trading strategies. Remember, the effectiveness of this tool largely depends on its customization to the specific market context.
Note: Backtests are based on past results and do not guarantee future performance.

Колебания ликвидности - Liquidity Swings [Midas]Индикатор «Колебания ликвидности - Liquidity Swings » выделяет swing-зоны, в которых наблюдается торговая активность. Количество повторных входов цены в swing-зону отображается с помощью области, определяющей границы этих зон. Кроме того, накопленный объём внутри swing-зон отмечается метками на графике. Также предусмотрена возможность фильтрации swing-зон, объём или количество которых не достигает порогового значения, установленного пользователем.
По своей природе данный индикатор не работает в режиме реального времени и предназначен для описательного анализа в сочетании с другими компонентами скрипта. Это нормальное поведение для скриптов, определяющих поворотные точки в рамках системы, и важно понимать, что метки поворотных точек не предназначены для торговли в реальном времени.
🔶 ИСПОЛЬЗОВАНИЕ
Индикатор можно использовать для выделения значимых swing-зон, которые могут представлять собой зоны накопления/распределения на более низких таймфреймах и впоследствии играть роль уровней поддержки или сопротивления.
Также выделяются уровни swing. При пробое уровня swing он отображается в виде пунктирной линии. Пробой swing-высокого уровня является бычьим сигналом, а пробой swing-низкого — медвежьим.
Фильтрация swing-зон по объёму позволяет отображать только значимые зоны с более высокой ликвидностью. Такие swing-зоны могут быть шире (что указывает на повышенную волатильность) или же могли быть посещены ценой чаще.
🔶 НАСТРОЙКИ
Период пивота: Период обратного просмотра, используемый для расчёта поворотных точек.
Область свинга: Определяет, как рассчитывается swing-зона. При выборе «Край фитиля» используется диапазон от максимальной цены до максимума из цены закрытия и открытия для swing high, и диапазон от минимальной цены до минимума из цены закрытия и открытия для swing low. При выборе «Полный диапазон» используется полный диапазон свечи как swing-зона.
Точность: Использовать внутрисвечные данные для расчёта накопленного объёма в swing-зоне, что позволяет получать более точные результаты.
Фильтрация: Определяет критерий фильтрации swing-зон, отфильтровывает swing-зоны, которые цена посетила меньше раз, чем установлено пользователем. Опция «Объем» отфильтровывает swing-зоны, в которых накопленный объём меньше порогового значения, заданного пользователем.
🔹 Стиль
Пивот верх: Отображать swing high.
Пивот низ: Отображать swing low.
Размер меток: Размер меток на графике.
Обратите внимание, что точки swing подтверждаются спустя количество баров, заданное параметром "Область свинга", поэтому все элементы отображаются с ретроспективным отступом.

Midnight Opening Ranges[TDL]Midnight Opening Range Indicator for TradingView
Description:
The Midnight Opening Range Indicator as taught by Micheal J. Huddleston is a powerful tool designed for traders who want to analyze price action during the critical midnight to 00:30 timeframe. This indicator highlights the opening range for both the current day and previous days, providing valuable insights into market behavior during this specific period. It also calculates and displays deviations from the opening range, as well as allows for custom opening prices to be set, making it highly adaptable to your trading strategy.
Key Features:
Today's Opening Range (00:00 - 00:30):
The indicator plots the high and low of the price range between 00:00 and 00:30 for the current day.
This range is highlighted on the chart, making it easy to identify the initial market movement and potential support/resistance levels.
Previous Days' Opening Ranges:
The indicator also displays the opening ranges for previous days, allowing you to how price reacts off of previous days ranges not just todays.
This feature helps in identifying patterns or recurring behaviors in the market in which price uses this range and previous days ranges throughout the trading day.
Deviations from the Opening Range:
The indicator calculates and plots deviations from the opening range, both above and below the high and low of the range.
These deviations can be used to identify potential breakout or reversal points, giving you an edge in anticipating market moves.
Custom Opening Prices:
The indicator allows you to set custom opening prices, which can be useful if you want to analyze the market based on a specific reference point rather than the default midnight opening.
This feature is particularly useful for traders who follow alternative trading sessions or have specific entry criteria.
Customizable Visuals:
The indicator offers customizable colors and styles for the opening range, deviations, and custom opening prices, allowing you to tailor the visual representation to your preferences.
How to Use:
Identify Key Levels: Use the highlighted opening range to identify key support and resistance levels for the day.
Monitor Deviations: Watch for price movements beyond the opening range deviations to spot potential breakouts or reversals.
Previous Range Data: Use previous days to identify areas of potential AMD.
Set Custom Prices: Adjust the custom opening price to align with your trading strategy or session preferences.
Ideal For:
Day Traders: Perfect for traders who focus on the early hours of the market to capture initial momentum.
Swing Traders: Useful for identifying key levels that could influence price action over several days.
Algorithmic Traders: Can be integrated into automated trading systems to trigger trades based on the opening range and deviations.
Conclusion:
The Midnight Opening Range Indicator is an essential tool for any trader looking to gain an edge in the market by focusing on the critical midnight to 00:30 timeframe. With its ability to highlight opening ranges, calculate deviations, and accommodate custom opening prices, this indicator provides a comprehensive view of market behavior during this pivotal period. Whether you're a day trader, swing trader, or algorithmic trader, this indicator will help you make more informed trading decisions.
VWAP EMA BreakoutThis strategy combines both short term trend and long term trend with volume to find the bias for intraday. It works optimally in 15 min timeframe.

Market Pulse BandsWhen the market is in a bullish trend (close price above the basis line), the basis line will be displayed in green.
When the market is in a bearish trend (close price below the basis line), the basis line will be displayed in red.
The upper and lower bands remain in blue to visually represent the Bollinger-like bands.

Pipstocrat Market Participant Analysis📊 Pipstocrat Market Participant Analysis (MPA) Indicator
🔍 Uncover Market Intentions & Trade with Confidence
The MPA Indicator is a powerful sentiment tool that reveals the activity of different trader groups, helping you identify smart money movements, retail traps, and liquidity shifts.
📌 Who’s in Control?
🟠 Retail Traders (Gray) – Typically react late and move against institutional trends.
🔵 Hot Money (Blue/Orange) – Short-term aggressive traders who create liquidity spikes.
🟢 Smart Money (Green/Red) – Institutional traders who drive the market’s real direction.
Using RSI-based calculations, volume confirmation, and engulfing patterns, the MPA indicator highlights key liquidity zones and price exhaustion points.
⚡ Key Features
✅ Multi-Layered Market Analysis – Distinguish between retail speculation and institutional positioning.
✅ 🔥 Engulfing Volume Detection – Identifies high-volume bullish & bearish engulfing bars.
✅ 🎨 Dynamic Coloring – Histogram bars adapt based on market conditions.
✅ 🏦 Institutional vs. Retail Activity – Understand liquidity flow and market bias.
✅ 📏 Support, Neutral & Resistance Levels – Levels 5, 10, and 15 mark liquidity exhaustion zones.
✅ 🔍 Volume-Weighted Movements – Ensures signals align with actual liquidity shifts.
✅ 🎛️ Customizable Settings – Adjust transparency, background color, and visibility.
📈 How to Use MPA for Trading
🔹 Identify Smart Money Activity
🟢 Green → Institutions are accumulating (bullish bias).
🔴 Red → Institutions are distributing (bearish bias).
🔹 Spot Liquidity Grabs with Hot Money
🔵 Blue (Bullish Spike) → Short-term upside pressure (possible pullback before continuation).
🟠 Orange (Bearish Spike) → Short-term downside pressure (possible retracement).
🔹 Engulfing Volume Confirmation
📈 Bullish Engulfing + High Volume → Possible buy signal if in confluence with Smart Money accumulation.
📉 Bearish Engulfing + High Volume → Possible sell signal if institutions are distributing.
🔹 Use Key Support & Resistance Levels
🔹 Level 5 → Minor liquidity zone, watch for price reactions.
🔸 Level 10 → Neutral ground – Wait for a breakout confirmation.
🔺 Level 15 → Strong liquidity area; potential reversal zone.
🚀 Why MPA is a Game-Changer?
⚡ Avoid Retail Traps – Follow the money, not the herd.
🎯 Improve Entry Timing – Identify high-probability liquidity-driven setups.
🔍 Enhance Confluence – Works well with ICT, SMC, or any smart money strategy.
❌ Eliminate Noise – Focus on real market dynamics, not lagging indicators.
🔥 **Maximize Your Edge – Trade with Market Knowledge. 🔥
💾 Save, Share & Add to Favorites if you find MPA useful!

Trend Detection in one shotConfused about trends ?
Author: Anmol-max-star
Description
The HalfTrend indicator is a powerful trend-following tool that combines moving averages with ATR (Average True Range) to identify trend changes and potential reversal points. It features dynamic support/resistance levels, visual signals, and customizable parameters for different trading styles and timeframes.
Key Features
Dynamic trend identification
ATR-based volatility bands
Automatic trend reversal signals
Visual trend confirmation arrows
Customizable sensitivity settings
Indicator Components
Main Trend Line
Green: Uptrend
Red: Downtrend
ATR Bands
Upper and lower volatility channels
Based on ATR multiplier
Acts as dynamic support/resistance
Signal Arrows
Green Up Arrow: Trend change to uptrend
Red Down Arrow: Trend change to downtrend
Parameters
Amplitude (Default: 2)
Controls trend sensitivity
Lower values (1-2): More sensitive, more signals
Higher values (2-4): Less sensitive, fewer signals
Channel Deviation (Default: 2)
Controls ATR band width
Higher values: Wider bands
Lower values: Tighter bands
Show Arrows (Default: true)
Toggle arrow visibility
Useful for chart clarity
How to Use
Trading Signals
Buy Signals
Green trend line appears
Green arrow forms
Price above trend line
Sell Signals
Red trend line appears
Red arrow forms
Price below trend line
Stop Loss Placement
Long Positions: Below the trend line or lower band
Short Positions: Above the trend line or upper band
Timeframe Selection
Short-term: 5m, 15m, 1h charts
Swing trading: 4h, Daily charts
Long-term: Weekly charts
Best Practices
Entry Rules
Wait for trend line color change
Confirm with arrow signal
Check overall market direction
Consider volume confirmation
Exit Rules
Trend line break
Opposite arrow signal
ATR band penetration
Trailing stop using trend line
Risk Management
Position size based on ATR
Use ATR bands for stop placement
Trail stops with trend line
Scale in/out at band touches
Optimization Tips
For Different Markets
Trending Markets: Use default settings
Volatile Markets: Increase Channel Deviation
Ranging Markets: Decrease Amplitude
For Different Timeframes
Lower Timeframes (5m-1h):
Amplitude: 1-2
Channel Deviation: 1.5-2
Higher Timeframes (4h-1D):
Amplitude: 2-3
Channel Deviation: 2-2.5
Common Mistakes to Avoid
Don't trade against the main trend
Don't ignore overall market context
Don't chase signals after extended moves
Don't override system signals
Don't forget to use stops
Recommended Settings
Conservative Trading
Amplitude: 3
Channel Deviation: 2.5
Better for higher timeframes
Aggressive Trading
Amplitude: 1.5
Channel Deviation: 1.5
Better for lower timeframes
Swing Trading
Amplitude: 2
Channel Deviation: 2
Ideal for 4h-Daily charts
Alert Settings
Trend Changes
"Uptrend Start"
"Downtrend Start"
Price vs. Bands
Price crossing trend line
Price touching ATR bands
Additional Notes
Works best in trending markets
Combine with volume analysis
Use with support/resistance levels
Consider multiple timeframe analysis
Regular parameter optimization recommended

Trader Criptom4N//@version=5
indicator("Trader Criptom4N", "🐳Criptom4N®🐳"
, overlay = true
, max_labels_count = 500
, max_lines_count = 500
, max_boxes_count = 500
, max_bars_back = 500)
//INICIA MODULO SUPERTREND
// Get user input
//INICIA MODULO SUPERTREND
// Get user input
// Instead of inputs, define constants or variables directly
// Instead of inputs, define constants or variables directly
var float nsensitivity = 1
nbuysell = input.bool(true, 'Buy/Sell Signal', inline = "BSNM",group='BUY/SELL SIGNAL')
// SMA
sma4_strong = ta.sma(close, 8)
sma5_strong = ta.sma(close, 9)
// Signal Generation
// Signal Generation Function
supertrend(_src, factor, atrLen) =>
atr = ta.atr(atrLen)
upperBand = _src + factor * atr
lowerBand = _src - factor * atr
prevLowerBand = nz(lowerBand )
prevUpperBand = nz(upperBand )
lowerBand := lowerBand > prevLowerBand or close < prevLowerBand ? lowerBand : prevLowerBand
upperBand := upperBand < prevUpperBand or close > prevUpperBand ? upperBand : prevUpperBand
var int direction = na
var float superTrend = na
prevSuperTrend = nz(superTrend )
if na(atr )
direction := 1
else if prevSuperTrend == prevUpperBand
direction := close > upperBand ? -1 : 1
else
direction := close < lowerBand ? 1 : -1
superTrend := direction == -1 ? lowerBand : upperBand
= supertrend(close, nsensitivity*7,10)
//señales
bull = ta.crossover(close, supertrend)
bear = ta.crossunder(close, supertrend)
//FIN MODULO SUPERTREND
// Risk Management
levels2 = input.bool(true, "Show TP/SL Levels2" , group = "Risk Management" , inline = "MMDB2")
lvlLines = input.bool(true, "Show Lines ", inline="levels2", group = "Risk Management")
linesStyle = input.string("SOLID", "", , inline="levels2", group = "Risk Management")
lvlDistance = input.int(40, "Distance", 1, inline="levels2", group = "Risk Management")
lvlDecimals = input.int(4, " Decimals", 1, 8, inline="levels2", group = "Risk Management")
atrRisk = input.int(3, "Risk % ", 1, group = "Risk Management" , inline="levels3")
atrLen = input.int(14, " ATR Length", 1, group = "Risk Management" , inline="levels3")
decimals = lvlDecimals == 1 ? "#.#" : lvlDecimals == 2 ? "#.##" : lvlDecimals == 3 ? "#.###" : lvlDecimals == 4 ? "#.####" : lvlDecimals == 5 ? "#.#####" : lvlDecimals == 6 ? "#.######" : lvlDecimals == 7 ? "#.#######" : "#.########"
CirrusCloud = input(true, 'Cirrus Cloud', group='TREND FEATURES')
// Plots
windowsize = 100
offset = 0.9
sigma = 6
//plot(ta.alma(source, windowsize, offset, sigma))
windowsize2 = 310
offset2 = 0.85
sigma2 = 32
//plot(ta.alma(source, windowsize2, offset2, sigma2))
// Chart Features
smoothrng(x, t, m) =>
wper = t * 2 - 1
avrng = ta.ema(math.abs(x - x ), t)
smoothrng = ta.ema(avrng, wper) * m
smoothrng
smrng = smoothrng(close, 22, 6)
rngfilt(x, r) =>
rngfilt = x
rngfilt := x > nz(rngfilt ) ? x - r < nz(rngfilt ) ? nz(rngfilt ) : x - r : x + r > nz(rngfilt ) ? nz(rngfilt ) : x + r
rngfilt
filt = rngfilt(close, smrng)
// ▒▒▒▒▒▒▒▒▒▒▒▒▒▒▒▒▒▒▒▒▒▒▒▒▒▒▒▒▒▒▒▒▒▒▒▒▒▒▒▒▒▒▒▒▒▒▒▒▒▒▒▒▒▒▒▒▒▒▒▒▒▒▒▒▒▒▒▒▒▒▒▒▒▒▒▒▒▒▒▒▒▒▒▒▒▒▒▒▒▒▒▒▒▒▒▒▒▒▒▒▒▒▒▒▒▒▒▒▒▒▒▒▒▒
upward = 0.0
upward := filt > filt ? nz(upward ) + 1 : filt < filt ? 0 : nz(upward )
downward = 0.0
downward := filt < filt ? nz(downward ) + 1 : filt > filt ? 0 : nz(downward )
filtcolor = upward > 0 ? color.new(#00e2ff, 50) : downward > 0 ? color.new(#fe0100, 50) : color.new(#56328f, 0)
// Trend Cloud
tclength = 600
hullma = ta.wma(2*ta.wma(close, tclength/2)-ta.wma(close, tclength), math.floor(math.sqrt(tclength)))
// Chart Features
x1 = 22
x2 = 9
x3 = 15
x4 = 5
smoothrngX1(x, t, m) =>
wper = t * 2 - 1
avrng = ta.ema(math.abs(x - x ), t)
smoothrngX1 = ta.ema(avrng, wper) * m
smoothrngX1
smrngx1x = smoothrngX1(close, x1, x2)
smrngx1x2 = smoothrngX1(close, x3, x4)
rngfiltx1x1(x, r) =>
rngfiltx1x1 = x
rngfiltx1x1 := x > nz(rngfiltx1x1 ) ? x - r < nz(rngfiltx1x1 ) ? nz(rngfiltx1x1 ) : x - r : x + r > nz(rngfiltx1x1 ) ? nz(rngfiltx1x1 ) : x + r
rngfiltx1x1
filtx1 = rngfiltx1x1(close, smrngx1x)
filtx12 = rngfiltx1x1(close, smrngx1x2)
// ▒▒▒▒▒▒▒▒▒▒▒▒▒▒▒▒▒▒▒▒▒▒▒▒▒▒▒▒▒▒▒▒▒▒▒▒▒▒▒▒▒▒▒▒▒▒▒▒▒▒▒▒▒▒▒▒▒▒▒▒▒▒▒▒▒▒▒▒▒▒▒▒▒▒▒▒▒▒▒▒▒▒▒▒▒▒▒▒▒▒▒▒▒▒▒▒▒▒▒▒▒▒▒▒▒▒▒▒▒▒▒▒▒▒
upwardx1 = 0.0
upwardx1 := filtx1 > filtx1 ? nz(upwardx1 ) + 1 : filtx1 < filtx1 ? 0 : nz(upwardx1 )
downwardx1 = 0.0
downwardx1 := filtx1 < filtx1 ? nz(downwardx1 ) + 1 : filtx1 > filtx1 ? 0 : nz(downwardx1 )
filtx1colorx1 = color.rgb(0, 187, 212, 100)
xxx1 = plot(CirrusCloud ? filtx1 : na, color=filtx1colorx1, linewidth=1, title='Trend Tracer', editable = false)
xxx2 = plot(CirrusCloud ? filtx12 : na, color=filtx1colorx1, linewidth=1, title='Trend Tracer', editable = false)
fill(xxx1, xxx2, color= filtx1 > filtx12 ? color.rgb(254, 0, 0, 86) : color.rgb(21, 255, 0, 86))
trigger2 = bull ? 1 : 0
countBull = ta.barssince(bull)
countBear = ta.barssince(bear)
trigger = nz(countBull, bar_index) < nz(countBear, bar_index) ? 1 : 0
atrBand = ta.atr(atrLen) * atrRisk
atrStop = trigger == 1 ? low - atrBand : high + atrBand
// Colors
green = #2BBC4D, green2 = color.rgb(0, 221, 0, 27)
red = #C51D0B, red2 = #c51d0b
adxlen = 15
dilen = 15
dirmov(len) =>
up = ta.change(high)
down = -ta.change(low)
plusDM = na(up) ? na : up > down and up > 0 ? up : 0
minusDM = na(down) ? na : down > up and down > 0 ? down : 0
truerange = ta.rma(ta.tr, len)
plus = fixnan(100 * ta.rma(plusDM, len) / truerange)
minus = fixnan(100 * ta.rma(minusDM, len) / truerange)
adx(dilen, adxlen) =>
= dirmov(dilen)
sum = plus + minus
adx = 100 * ta.rma(math.abs(plus - minus) / (sum == 0 ? 1 : sum), adxlen)
adx
sig = adx(dilen, adxlen)
// range ADX threshold
sidewaysThreshold = input.int(title='ADX Sideways Threshold (10-30)', minval=2, defval=15)
// boolean expression to see if the ADX is below tehe sideways threshold
bool isSideways = sig < sidewaysThreshold
// adding the option to color the bars when in a trading range
useBarColor = true
bColor = isSideways ? #b102fc : na
barcolor(useBarColor ? bColor : na)
barcolor(close > supertrend ? #3cff00 : #fe0100)
percentStop = input.float(1, "Stop Loss % (0 to Disable)", 0, group="BUY & SELL SIGNALS")
srcStop = close
lastTrade(src) => ta.valuewhen(bull or bear, src, 0)
entry_y = lastTrade(srcStop)
stop_y = lastTrade(atrStop)
tp1_y = (entry_y - lastTrade(atrStop)) * 1 + entry_y
tp2_y = (entry_y - lastTrade(atrStop)) * 2 + entry_y
tp3_y = (entry_y - lastTrade(atrStop)) * 3 + entry_y
labelTpSl(y, txt, color) =>
label labelTpSl = percentStop != 0 ? label.new(bar_index + 1, y, txt, xloc.bar_index, yloc.price, color, label.style_label_left, #000000, size.normal) : na
label.delete(labelTpSl )
if (levels2)
labelTpSl(entry_y, " Entry -- " + str.tostring(entry_y, decimals), color.gray)
labelTpSl(stop_y , " Stop Loss -- " + str.tostring(stop_y, decimals), #f90808)
labelTpSl(tp1_y, " TP 1 -- " + str.tostring(tp1_y, decimals), #00ff08)
labelTpSl(tp2_y, " TP 2 -- " + str.tostring(tp2_y, decimals), #00ff08)
labelTpSl(tp3_y, " TP 3 -- " + str.tostring(tp3_y, decimals), #00ff08)
style2 = linesStyle == "SOLID" ? line.style_solid : linesStyle == "DASHED" ? line.style_dashed : line.style_dotted
lineTpSl(y, color) =>
line lineTpSl = percentStop != 0 ? line.new(bar_index - (trigger ? countBull : countBear) + 4, y, bar_index + 1, y, xloc.bar_index, extend.none, color, style2) : na
line.delete(lineTpSl )
if (lvlLines)
lineTpSl(entry_y, color.green)
lineTpSl(stop_y, color.red)
lineTpSl(tp1_y, color.green)
lineTpSl(tp2_y, color.green)
lineTpSl(tp3_y, color.green)
y1 = low - (ta.atr(30) * 2), y1B = low - ta.atr(30)
y2 = high + (ta.atr(30) * 2), y2B = high + ta.atr(30)
buy = bull and nbuysell ? label.new(bar_index, y1, sma4_strong >= sma5_strong ? "🚀" : "🚀", xloc.bar_index, yloc.price, color.rgb(10, 247, 18, 60), label.style_label_up, #000000, size.normal) : na
sell = bear and nbuysell ? label.new(bar_index, y2, sma4_strong <= sma5_strong ? "🐻" : "🐻", xloc.bar_index, yloc.price, color.rgb(239, 12, 12, 66), label.style_label_down, #000000, size.normal) : na
int volSen = 3
plotchar(volSen, "volSen", "", location.top)
// Get Components
ema1 = ta.ema(ohlc4, 5*volSen)
ema2 = ta.ema(ohlc4, 9*volSen)
ema3 = ta.ema(ohlc4, 13*volSen)
ema4 = ta.ema(ohlc4, 34*volSen)
ema5 = ta.ema(ohlc4, 50*volSen)
alertcondition(bull, title='Buy Signal', message = "BUY")
alertcondition(bear, title='sell Signal', message = "BUY")
//-----------------------------------------------------------------------------{
//Constants
//-----------------------------------------------------------------------------{
color TRANSP_CSS = #ffffff00
//Tooltips
string MODE_TOOLTIP = 'Allows to display historical Structure or only the recent ones'
string STYLE_TOOLTIP = 'Indicator color theme'
string COLOR_CANDLES_TOOLTIP = 'Display additional candles with a color reflecting the current trend detected by structure'
string SHOW_INTERNAL = 'Display internal market structure'
string CONFLUENCE_FILTER = 'Filter non significant internal structure breakouts'
string SHOW_SWING = 'Display swing market Structure'
string SHOW_SWING_POINTS = 'Display swing point as labels on the chart'
string SHOW_SWHL_POINTS = 'Highlight most recent strong and weak high/low points on the chart'
string INTERNAL_OB = 'Display internal order blocks on the chart Number of internal order blocks to display on the chart'
string SWING_OB = 'Display swing order blocks on the chart Number of internal swing blocks to display on the chart'
string FILTER_OB = 'Method used to filter out volatile order blocks It is recommended to use the cumulative mean range method when a low amount of data is available'
string SHOW_EQHL = 'Display equal highs and equal lows on the chart'
string EQHL_BARS = 'Number of bars used to confirm equal highs and equal lows'
string EQHL_THRESHOLD = 'Sensitivity threshold in a range (0, 1) used for the detection of equal highs & lows Lower values will return fewer but more pertinent results'
string SHOW_FVG = 'Display fair values gaps on the chart'
string AUTO_FVG = 'Filter out non significant fair value gaps'
string FVG_TF = 'Fair value gaps timeframe'
string EXTEND_FVG = 'Determine how many bars to extend the Fair Value Gap boxes on chart'
string PED_ZONES = 'Display premium, discount, and equilibrium zones on chart'
//-----------------------------------------------------------------------------{
//Settings
//-----------------------------------------------------------------------------{
//General
//----------------------------------------{
mode = input.string('Historical'
, options =
, group = 'Smart Money Concepts'
, tooltip = MODE_TOOLTIP)
style = input.string('Colored'
, options =
, group = 'Smart Money Concepts'
, tooltip = STYLE_TOOLTIP)
show_trend = input(false, 'Color Candles'
, group = 'Smart Money Concepts'
, tooltip = COLOR_CANDLES_TOOLTIP)
//----------------------------------------}
//Internal Structure
//----------------------------------------{
show_internals = input(false, 'Show Internal Structure'
, group = 'Real Time Internal Structure'
, tooltip = SHOW_INTERNAL)
show_ibull = input.string('All', 'Bullish Structure'
, options =
, inline = 'ibull'
, group = 'Real Time Internal Structure')
swing_ibull_css = input(#089981, ''
, inline = 'ibull'
, group = 'Real Time Internal Structure')
//Bear Structure
show_ibear = input.string('All', 'Bearish Structure'
, options =
, inline = 'ibear'
, group = 'Real Time Internal Structure')
swing_ibear_css = input(#f23645, ''
, inline = 'ibear'
, group = 'Real Time Internal Structure')
ifilter_confluence = input(false, 'Confluence Filter'
, group = 'Real Time Internal Structure'
, tooltip = CONFLUENCE_FILTER)
internal_structure_size = input.string('Tiny', 'Internal Label Size'
, options =
, group = 'Real Time Internal Structure')
//----------------------------------------}
//Swing Structure
//----------------------------------------{
show_Structure = input(true, 'Show Swing Structure'
, group = 'Real Time Swing Structure'
, tooltip = SHOW_SWING)
//Bull Structure
show_bull = input.string('All', 'Bullish Structure'
, options =
, inline = 'bull'
, group = 'Real Time Swing Structure')
swing_bull_css = input(color.rgb(0, 0, 0), ''
, inline = 'bull'
, group = 'Real Time Swing Structure')
//Bear Structure
show_bear = input.string('All', 'Bearish Structure'
, options =
, inline = 'bear'
, group = 'Real Time Swing Structure')
swing_bear_css = input(#000000, ''
, inline = 'bear'
, group = 'Real Time Swing Structure')
swing_structure_size = input.string('Small', 'Swing Label Size'
, options =
, group = 'Real Time Swing Structure')
//Swings
show_swings = input(false, 'Show Swings Points'
, inline = 'swings'
, group = 'Real Time Swing Structure'
, tooltip = SHOW_SWING_POINTS)
length = input.int(50, ''
, minval = 10
, inline = 'swings'
, group = 'Real Time Swing Structure')
show_hl_swings = input(true, 'Show Strong/Weak High/Low'
, group = 'Real Time Swing Structure'
, tooltip = SHOW_SWHL_POINTS)
//----------------------------------------}
//Order Blocks
//----------------------------------------{
show_iob = input(false, 'Internal Order Blocks'
, inline = 'iob'
, group = 'Order Blocks'
, tooltip = INTERNAL_OB)
iob_showlast = input.int(5, ''
, minval = 1
, inline = 'iob'
, group = 'Order Blocks')
show_ob = input(true, 'Swing Order Blocks'
, inline = 'ob'
, group = 'Order Blocks'
, tooltip = SWING_OB)
ob_showlast = input.int(5, ''
, minval = 1
, inline = 'ob'
, group = 'Order Blocks')
ob_filter = input.string('Atr', 'Order Block Filter'
, options =
, group = 'Order Blocks'
, tooltip = FILTER_OB)
ibull_ob_css = input.color(#ffdd0033, 'Internal Bullish OB'
, group = 'Order Blocks')
ibear_ob_css = input.color(#ffdd0033, 'Internal Bearish OB'
, group = 'Order Blocks')
bull_ob_css = input.color(color.rgb(255, 255, 255, 80), 'Bullish OB'
, group = 'Order Blocks')
bear_ob_css = input.color(color.rgb(255, 255, 255, 80), 'Bearish OB'
, group = 'Order Blocks')
//----------------------------------------}
//EQH/EQL
//----------------------------------------{
show_eq = input(false, 'Equal High/Low'
, group = 'EQH/EQL'
, tooltip = SHOW_EQHL)
eq_len = input.int(3, 'Bars Confirmation'
, minval = 1
, group = 'EQH/EQL'
, tooltip = EQHL_BARS)
eq_threshold = input.float(0.1, 'Threshold'
, minval = 0
, maxval = 0.5
, step = 0.1
, group = 'EQH/EQL'
, tooltip = EQHL_THRESHOLD)
eq_size = input.string('Tiny', 'Label Size'
, options =
, group = 'EQH/EQL')
//----------------------------------------}
//Fair Value Gaps
//----------------------------------------{
show_fvg = input(true, 'Fair Value Gaps'
, group = 'Fair Value Gaps'
, tooltip = SHOW_FVG)
fvg_auto = input(true, "Auto Threshold"
, group = 'Fair Value Gaps'
, tooltip = AUTO_FVG)
fvg_tf = input.timeframe('', "Timeframe"
, group = 'Fair Value Gaps'
, tooltip = FVG_TF)
bull_fvg_css = input.color(#ddff006f, 'Bullish FVG'
, group = 'Fair Value Gaps')
bear_fvg_css = input.color(#f2ff0060, 'Bearish FVG'
, group = 'Fair Value Gaps')
fvg_extend = input.int(10, "Extend FVG"
, minval = 0
, group = 'Fair Value Gaps'
, tooltip = EXTEND_FVG)
//----------------------------------------}
//Previous day/week high/low
//----------------------------------------{
//Daily
show_pdhl = input(false, 'Daily'
, inline = 'daily'
, group = 'Highs & Lows MTF')
pdhl_style = input.string('⎯⎯⎯', ''
, options =
, inline = 'daily'
, group = 'Highs & Lows MTF')
pdhl_css = input(#2157f3, ''
, inline = 'daily'
, group = 'Highs & Lows MTF')
//Weekly
show_pwhl = input(false, 'Weekly'
, inline = 'weekly'
, group = 'Highs & Lows MTF')
pwhl_style = input.string('⎯⎯⎯', ''
, options =
, inline = 'weekly'
, group = 'Highs & Lows MTF')
pwhl_css = input(#2157f3, ''
, inline = 'weekly'
, group = 'Highs & Lows MTF')
//Monthly
show_pmhl = input(false, 'Monthly'
, inline = 'monthly'
, group = 'Highs & Lows MTF')
pmhl_style = input.string('⎯⎯⎯', ''
, options =
, inline = 'monthly'
, group = 'Highs & Lows MTF')
pmhl_css = input(#2157f3, ''
, inline = 'monthly'
, group = 'Highs & Lows MTF')
//----------------------------------------}
//Premium/Discount zones
//----------------------------------------{
show_sd = input(false, 'Premium/Discount Zones'
, group = 'Premium & Discount Zones'
, tooltip = PED_ZONES)
premium_css = input.color(#f23645, 'Premium Zone'
, group = 'Premium & Discount Zones')
eq_css = input.color(#b2b5be, 'Equilibrium Zone'
, group = 'Premium & Discount Zones')
discount_css = input.color(#089981, 'Discount Zone'
, group = 'Premium & Discount Zones')
//-----------------------------------------------------------------------------}
//Functions
//-----------------------------------------------------------------------------{
n = bar_index
atr = ta.atr(200)
cmean_range = ta.cum(high - low) / n
//HL Output function
hl() =>
//Get ohlc values function
get_ohlc()=> [close , open , high, low, high , low ]
//Display Structure function
display_Structure(x, y, txt, css, dashed, down, lbl_size)=>
structure_line = line.new(x, y, n, y
, color = css
, style = dashed ? line.style_dashed : line.style_solid)
structure_lbl = label.new(int(math.avg(x, n)), y, txt
, color = TRANSP_CSS
, textcolor = css
, style = down ? label.style_label_down : label.style_label_up
, size = lbl_size)
if mode == 'Present'
line.delete(structure_line )
label.delete(structure_lbl )
//Swings detection/measurements
swings(len)=>
var os = 0
upper = ta.highest(len)
lower = ta.lowest(len)
os := high > upper ? 0 : low < lower ? 1 : os
top = os == 0 and os != 0 ? high : 0
btm = os == 1 and os != 1 ? low : 0
//Order block coordinates function
ob_coord(use_max, loc, target_top, target_btm, target_left, target_type)=>
min = 99999999.
max = 0.
idx = 1
ob_threshold = ob_filter == 'Atr' ? atr : cmean_range
//Search for highest/lowest high within the structure interval and get range
if use_max
for i = 1 to (n - loc)-1
if (high - low ) < ob_threshold * 2
max := math.max(high , max)
min := max == high ? low : min
idx := max == high ? i : idx
else
for i = 1 to (n - loc)-1
if (high - low ) < ob_threshold * 2
min := math.min(low , min)
max := min == low ? high : max
idx := min == low ? i : idx
array.unshift(target_top, max)
array.unshift(target_btm, min)
array.unshift(target_left, time )
array.unshift(target_type, use_max ? -1 : 1)
//Set order blocks
display_ob(boxes, target_top, target_btm, target_left, target_type, show_last, swing, size)=>
for i = 0 to math.min(show_last-1, size-1)
get_box = array.get(boxes, i)
box.set_lefttop(get_box, array.get(target_left, i), array.get(target_top, i))
box.set_rightbottom(get_box, array.get(target_left, i), array.get(target_btm, i))
box.set_extend(get_box, extend.right)
color css = na
if swing
if style == 'Monochrome'
css := array.get(target_type, i) == 1 ? color.new(#b2b5be, 80) : color.new(#5d606b, 80)
border_css = array.get(target_type, i) == 1 ? #b2b5be : #5d606b
box.set_border_color(get_box, border_css)
else
css := array.get(target_type, i) == 1 ? bull_ob_css : bear_ob_css
box.set_border_color(get_box, css)
box.set_bgcolor(get_box, css)
else
if style == 'Monochrome'
css := array.get(target_type, i) == 1 ? color.new(#b2b5be, 80) : color.new(#5d606b, 80)
else
css := array.get(target_type, i) == 1 ? ibull_ob_css : ibear_ob_css
box.set_border_color(get_box, css)
box.set_bgcolor(get_box, css)
//Line Style function
get_line_style(style) =>
out = switch style
'⎯⎯⎯' => line.style_solid
'----' => line.style_dashed
'····' => line.style_dotted
//Set line/labels function for previous high/lows
phl(h, l, tf, css)=>
var line high_line = line.new(na,na,na,na
, xloc = xloc.bar_time
, color = css
, style = get_line_style(pdhl_style))
var label high_lbl = label.new(na,na
, xloc = xloc.bar_time
, text = str.format('P{0}H', tf)
, color = TRANSP_CSS
, textcolor = css
, size = size.small
, style = label.style_label_left)
var line low_line = line.new(na,na,na,na
, xloc = xloc.bar_time
, color = css
, style = get_line_style(pdhl_style))
var label low_lbl = label.new(na,na
, xloc = xloc.bar_time
, text = str.format('P{0}L', tf)
, color = TRANSP_CSS
, textcolor = css
, size = size.small
, style = label.style_label_left)
hy = ta.valuewhen(h != h , h, 1)
hx = ta.valuewhen(h == high, time, 1)
ly = ta.valuewhen(l != l , l, 1)
lx = ta.valuewhen(l == low, time, 1)
if barstate.islast
ext = time + (time - time )*20
//High
line.set_xy1(high_line, hx, hy)
line.set_xy2(high_line, ext, hy)
label.set_xy(high_lbl, ext, hy)
//Low
line.set_xy1(low_line, lx, ly)
line.set_xy2(low_line, ext, ly)
label.set_xy(low_lbl, ext, ly)
//-----------------------------------------------------------------------------}
//Global variables
//-----------------------------------------------------------------------------{
var trend = 0, var itrend = 0
var top_y = 0., var top_x = 0
var btm_y = 0., var btm_x = 0
var itop_y = 0., var itop_x = 0
var ibtm_y = 0., var ibtm_x = 0
var trail_up = high, var trail_dn = low
var trail_up_x = 0, var trail_dn_x = 0
var top_cross = true, var btm_cross = true
var itop_cross = true, var ibtm_cross = true
var txt_top = '', var txt_btm = ''
//Alerts
bull_choch_alert = false
bull_bos_alert = false
bear_choch_alert = false
bear_bos_alert = false
bull_ichoch_alert = false
bull_ibos_alert = false
bear_ichoch_alert = false
bear_ibos_alert = false
bull_iob_break = false
bear_iob_break = false
bull_ob_break = false
bear_ob_break = false
eqh_alert = false
eql_alert = false
//Structure colors
var bull_css = style == 'Monochrome' ? #b2b5be
: swing_bull_css
var bear_css = style == 'Monochrome' ? #b2b5be
: swing_bear_css
var ibull_css = style == 'Monochrome' ? #b2b5be
: swing_ibull_css
var ibear_css = style == 'Monochrome' ? #b2b5be
: swing_ibear_css
//Labels size
var internal_structure_lbl_size = internal_structure_size == 'Tiny'
? size.tiny
: internal_structure_size == 'Small'
? size.small
: size.normal
var swing_structure_lbl_size = swing_structure_size == 'Tiny'
? size.tiny
: swing_structure_size == 'Small'
? size.small
: size.normal
var eqhl_lbl_size = eq_size == 'Tiny'
? size.tiny
: eq_size == 'Small'
? size.small
: size.normal
//Swings
= swings(length)
= swings(5)
//-----------------------------------------------------------------------------}
//Pivot High
//-----------------------------------------------------------------------------{
var line extend_top = na
var label extend_top_lbl = label.new(na, na
, color = TRANSP_CSS
, textcolor = bear_css
, style = label.style_label_down
, size = size.tiny)
if top
top_cross := true
txt_top := top > top_y ? 'HH' : 'LH'
if show_swings
top_lbl = label.new(n-length, top, txt_top
, color = TRANSP_CSS
, textcolor = bear_css
, style = label.style_label_down
, size = swing_structure_lbl_size)
if mode == 'Present'
label.delete(top_lbl )
//Extend recent top to last bar
line.delete(extend_top )
extend_top := line.new(n-length, top, n, top
, color = bear_css)
top_y := top
top_x := n - length
trail_up := top
trail_up_x := n - length
if itop
itop_cross := true
itop_y := itop
itop_x := n - 5
//Trailing maximum
trail_up := math.max(high, trail_up)
trail_up_x := trail_up == high ? n : trail_up_x
//Set top extension label/line
if barstate.islast and show_hl_swings
line.set_xy1(extend_top, trail_up_x, trail_up)
line.set_xy2(extend_top, n + 20, trail_up)
label.set_x(extend_top_lbl, n + 20)
label.set_y(extend_top_lbl, trail_up)
label.set_text(extend_top_lbl, trend < 0 ? 'Strong High' : 'Weak High')
//-----------------------------------------------------------------------------}
//Pivot Low
//-----------------------------------------------------------------------------{
var line extend_btm = na
var label extend_btm_lbl = label.new(na, na
, color = TRANSP_CSS
, textcolor = bull_css
, style = label.style_label_up
, size = size.tiny)
if btm
btm_cross := true
txt_btm := btm < btm_y ? 'LL' : 'HL'
if show_swings
btm_lbl = label.new(n - length, btm, txt_btm
, color = TRANSP_CSS
, textcolor = bull_css
, style = label.style_label_up
, size = swing_structure_lbl_size)
if mode == 'Present'
label.delete(btm_lbl )
//Extend recent btm to last bar
line.delete(extend_btm )
extend_btm := line.new(n - length, btm, n, btm
, color = bull_css)
btm_y := btm
btm_x := n-length
trail_dn := btm
trail_dn_x := n-length
if ibtm
ibtm_cross := true
ibtm_y := ibtm
ibtm_x := n - 5
//Trailing minimum
trail_dn := math.min(low, trail_dn)
trail_dn_x := trail_dn == low ? n : trail_dn_x
//Set btm extension label/line
if barstate.islast and show_hl_swings
line.set_xy1(extend_btm, trail_dn_x, trail_dn)
line.set_xy2(extend_btm, n + 20, trail_dn)
label.set_x(extend_btm_lbl, n + 20)
label.set_y(extend_btm_lbl, trail_dn)
label.set_text(extend_btm_lbl, trend > 0 ? 'Strong Low' : 'Weak Low')
//-----------------------------------------------------------------------------}
//Order Blocks Arrays
//-----------------------------------------------------------------------------{
var iob_top = array.new_float(0)
var iob_btm = array.new_float(0)
var iob_left = array.new_int(0)
var iob_type = array.new_int(0)
var ob_top = array.new_float(0)
var ob_btm = array.new_float(0)
var ob_left = array.new_int(0)
var ob_type = array.new_int(0)
//-----------------------------------------------------------------------------}
//Pivot High BOS/CHoCH
//-----------------------------------------------------------------------------{
//Filtering
var bull_concordant = true
if ifilter_confluence
bull_concordant := high - math.max(close, open) > math.min(close, open - low)
//Detect internal bullish Structure
if ta.crossover(close, itop_y) and itop_cross and top_y != itop_y and bull_concordant
bool choch = na
if itrend < 0
choch := true
bull_ichoch_alert := true
else
bull_ibos_alert := true
txt = choch ? 'CHoCH' : 'BOS'
if show_internals
if show_ibull == 'All' or (show_ibull == 'BOS' and not choch) or (show_ibull == 'CHoCH' and choch)
display_Structure(itop_x, itop_y, txt, ibull_css, true, true, internal_structure_lbl_size)
itop_cross := false
itrend := 1
//Internal Order Block
if show_iob
ob_coord(false, itop_x, iob_top, iob_btm, iob_left, iob_type)
//Detect bullish Structure
if ta.crossover(close, top_y) and top_cross
bool choch = na
if trend < 0
choch := true
bull_choch_alert := true
else
bull_bos_alert := true
txt = choch ? 'CHoCH' : 'BOS'
if show_Structure
if show_bull == 'All' or (show_bull == 'BOS' and not choch) or (show_bull == 'CHoCH' and choch)
display_Structure(top_x, top_y, txt, bull_css, false, true, swing_structure_lbl_size)
//Order Block
if show_ob
ob_coord(false, top_x, ob_top, ob_btm, ob_left, ob_type)
top_cross := false
trend := 1
//-----------------------------------------------------------------------------}
//Pivot Low BOS/CHoCH
//-----------------------------------------------------------------------------{
var bear_concordant = true
if ifilter_confluence
bear_concordant := high - math.max(close, open) < math.min(close, open - low)
//Detect internal bearish Structure
if ta.crossunder(close, ibtm_y) and ibtm_cross and btm_y != ibtm_y and bear_concordant
bool choch = false
if itrend > 0
choch := true
bear_ichoch_alert := true
else
bear_ibos_alert := true
txt = choch ? 'CHoCH' : 'BOS'
if show_internals
if show_ibear == 'All' or (show_ibear == 'BOS' and not choch) or (show_ibear == 'CHoCH' and choch)
display_Structure(ibtm_x, ibtm_y, txt, ibear_css, true, false, internal_structure_lbl_size)
ibtm_cross := false
itrend := -1
//Internal Order Block
if show_iob
ob_coord(true, ibtm_x, iob_top, iob_btm, iob_left, iob_type)
//Detect bearish Structure
if ta.crossunder(close, btm_y) and btm_cross
bool choch = na
if trend > 0
choch := true
bear_choch_alert := true
else
bear_bos_alert := true
txt = choch ? 'CHoCH' : 'BOS'
if show_Structure
if show_bear == 'All' or (show_bear == 'BOS' and not choch) or (show_bear == 'CHoCH' and choch)
display_Structure(btm_x, btm_y, txt, bear_css, false, false, swing_structure_lbl_size)
//Order Block
if show_ob
ob_coord(true, btm_x, ob_top, ob_btm, ob_left, ob_type)
btm_cross := false
trend := -1
//-----------------------------------------------------------------------------}
//Order Blocks
//-----------------------------------------------------------------------------{
//Set order blocks
var iob_boxes = array.new_box(0)
var ob_boxes = array.new_box(0)
//Delete internal order blocks box coordinates if top/bottom is broken
for element in iob_type
index = array.indexof(iob_type, element)
if close < array.get(iob_btm, index) and element == 1
array.remove(iob_top, index)
array.remove(iob_btm, index)
array.remove(iob_left, index)
array.remove(iob_type, index)
bull_iob_break := true
else if close > array.get(iob_top, index) and element == -1
array.remove(iob_top, index)
array.remove(iob_btm, index)
array.remove(iob_left, index)
array.remove(iob_type, index)
bear_iob_break := true
//Delete internal order blocks box coordinates if top/bottom is broken
for element in ob_type
index = array.indexof(ob_type, element)
if close < array.get(ob_btm, index) and element == 1
array.remove(ob_top, index)
array.remove(ob_btm, index)
array.remove(ob_left, index)
array.remove(ob_type, index)
bull_ob_break := true
else if close > array.get(ob_top, index) and element == -1
array.remove(ob_top, index)
array.remove(ob_btm, index)
array.remove(ob_left, index)
array.remove(ob_type, index)
bear_ob_break := true
iob_size = array.size(iob_type)
ob_size = array.size(ob_type)
if barstate.isfirst
if show_iob
for i = 0 to iob_showlast-1
array.push(iob_boxes, box.new(na,na,na,na, xloc = xloc.bar_time))
if show_ob
for i = 0 to ob_showlast-1
array.push(ob_boxes, box.new(na,na,na,na, xloc = xloc.bar_time))
if iob_size > 0
if barstate.islast
display_ob(iob_boxes, iob_top, iob_btm, iob_left, iob_type, iob_showlast, false, iob_size)
if ob_size > 0
if barstate.islast
display_ob(ob_boxes, ob_top, ob_btm, ob_left, ob_type, ob_showlast, true, ob_size)
//-----------------------------------------------------------------------------}
//EQH/EQL
//-----------------------------------------------------------------------------{
var eq_prev_top = 0.
var eq_top_x = 0
var eq_prev_btm = 0.
var eq_btm_x = 0
if show_eq
eq_top = ta.pivothigh(eq_len, eq_len)
eq_btm = ta.pivotlow(eq_len, eq_len)
if eq_top
max = math.max(eq_top, eq_prev_top)
min = math.min(eq_top, eq_prev_top)
if max < min + atr * eq_threshold
eqh_line = line.new(eq_top_x, eq_prev_top, n-eq_len, eq_top
, color = bear_css
, style = line.style_dotted)
eqh_lbl = label.new(int(math.avg(n-eq_len, eq_top_x)), eq_top, 'EQH'
, color = #00000000
, textcolor = bear_css
, style = label.style_label_down
, size = eqhl_lbl_size)
if mode == 'Present'
line.delete(eqh_line )
label.delete(eqh_lbl )
eqh_alert := true
eq_prev_top := eq_top
eq_top_x := n-eq_len
if eq_btm
max = math.max(eq_btm, eq_prev_btm)
min = math.min(eq_btm, eq_prev_btm)
if min > max - atr * eq_threshold
eql_line = line.new(eq_btm_x, eq_prev_btm, n-eq_len, eq_btm
, color = bull_css
, style = line.style_dotted)
eql_lbl = label.new(int(math.avg(n-eq_len, eq_btm_x)), eq_btm, 'EQL'
, color = #00000000
, textcolor = bull_css
, style = label.style_label_up
, size = eqhl_lbl_size)
eql_alert := true
if mode == 'Present'
line.delete(eql_line )
label.delete(eql_lbl )
eq_prev_btm := eq_btm
eq_btm_x := n-eq_len
//-----------------------------------------------------------------------------}
//Fair Value Gaps
//-----------------------------------------------------------------------------{
var bullish_fvg_max = array.new_box(0)
var bullish_fvg_min = array.new_box(0)
var bearish_fvg_max = array.new_box(0)
var bearish_fvg_min = array.new_box(0)
float bullish_fvg_avg = na
float bearish_fvg_avg = na
bullish_fvg_cnd = false
bearish_fvg_cnd = false
=
request.security(syminfo.tickerid, fvg_tf, get_ohlc())
if show_fvg
delta_per = (src_c1 - src_o1) / src_o1 * 100
change_tf = timeframe.change(fvg_tf)
threshold = fvg_auto ? ta.cum(math.abs(change_tf ? delta_per : 0)) / n * 2
: 0
//FVG conditions
bullish_fvg_cnd := src_l > src_h2
and src_c1 > src_h2
and delta_per > threshold
and change_tf
bearish_fvg_cnd := src_h < src_l2
and src_c1 < src_l2
and -delta_per > threshold
and change_tf
//FVG Areas
if bullish_fvg_cnd
array.unshift(bullish_fvg_max, box.new(n-1, src_l, n + fvg_extend, math.avg(src_l, src_h2)
, border_color = bull_fvg_css
, bgcolor = bull_fvg_css))
array.unshift(bullish_fvg_min, box.new(n-1, math.avg(src_l, src_h2), n + fvg_extend, src_h2
, border_color = bull_fvg_css
, bgcolor = bull_fvg_css))
if bearish_fvg_cnd
array.unshift(bearish_fvg_max, box.new(n-1, src_h, n + fvg_extend, math.avg(src_h, src_l2)
, border_color = bear_fvg_css
, bgcolor = bear_fvg_css))
array.unshift(bearish_fvg_min, box.new(n-1, math.avg(src_h, src_l2), n + fvg_extend, src_l2
, border_color = bear_fvg_css
, bgcolor = bear_fvg_css))
for bx in bullish_fvg_min
if low < box.get_bottom(bx)
box.delete(bx)
box.delete(array.get(bullish_fvg_max, array.indexof(bullish_fvg_min, bx)))
for bx in bearish_fvg_max
if high > box.get_top(bx)
box.delete(bx)
box.delete(array.get(bearish_fvg_min, array.indexof(bearish_fvg_max, bx)))
//-----------------------------------------------------------------------------}
//Previous day/week high/lows
//-----------------------------------------------------------------------------{
//Daily high/low
= request.security(syminfo.tickerid, 'D', hl()
, lookahead = barmerge.lookahead_on)
//Weekly high/low
= request.security(syminfo.tickerid, 'W', hl()
, lookahead = barmerge.lookahead_on)
//Monthly high/low
= request.security(syminfo.tickerid, 'M', hl()
, lookahead = barmerge.lookahead_on)
//Display Daily
if show_pdhl
phl(pdh, pdl, 'D', pdhl_css)
//Display Weekly
if show_pwhl
phl(pwh, pwl, 'W', pwhl_css)
//Display Monthly
if show_pmhl
phl(pmh, pml, 'M', pmhl_css)
//-----------------------------------------------------------------------------}
//Premium/Discount/Equilibrium zones
//-----------------------------------------------------------------------------{
var premium = box.new(na, na, na, na
, bgcolor = color.new(premium_css, 80)
, border_color = na)
var premium_lbl = label.new(na, na
, text = 'Premium'
, color = TRANSP_CSS
, textcolor = premium_css
, style = label.style_label_down
, size = size.small)
var eq = box.new(na, na, na, na
, bgcolor = color.rgb(120, 123, 134, 80)
, border_color = na)
var eq_lbl = label.new(na, na
, text = 'Equilibrium'
, color = TRANSP_CSS
, textcolor = eq_css
, style = label.style_label_left
, size = size.small)
var discount = box.new(na, na, na, na
, bgcolor = color.new(discount_css, 80)
, border_color = na)
var discount_lbl = label.new(na, na
, text = 'Discount'
, color = TRANSP_CSS
, textcolor = discount_css
, style = label.style_label_up
, size = size.small)
//Show Premium/Discount Areas
if barstate.islast and show_sd
avg = math.avg(trail_up, trail_dn)
box.set_lefttop(premium, math.max(top_x, btm_x), trail_up)
box.set_rightbottom(premium, n, .95 * trail_up + .05 * trail_dn)
label.set_xy(premium_lbl, int(math.avg(math.max(top_x, btm_x), n)), trail_up)
box.set_lefttop(eq, math.max(top_x, btm_x), .525 * trail_up + .475*trail_dn)
box.set_rightbottom(eq, n, .525 * trail_dn + .475 * trail_up)
label.set_xy(eq_lbl, n, avg)
box.set_lefttop(discount, math.max(top_x, btm_x), .95 * trail_dn + .05 * trail_up)
box.set_rightbottom(discount, n, trail_dn)
label.set_xy(discount_lbl, int(math.avg(math.max(top_x, btm_x), n)), trail_dn)
//-----------------------------------------------------------------------------}
//Trend
//-----------------------------------------------------------------------------{
var color trend_css = na
if show_trend
if style == 'Colored'
trend_css := itrend == 1 ? bull_css : bear_css
else if style == 'Monochrome'
trend_css := itrend == 1 ? #b2b5be : #5d606b
plotcandle(open, high, low, close
, color = trend_css
, wickcolor = trend_css
, bordercolor = trend_css
, editable = false)
//-----------------------------------------------------------------------------}
//Alerts
//-----------------------------------------------------------------------------{
//Internal Structure
alertcondition(bull_ibos_alert, 'Internal Bullish BOS', 'Internal Bullish BOS formed')
alertcondition(bull_ichoch_alert, 'Internal Bullish CHoCH', 'Internal Bullish CHoCH formed')
alertcondition(bear_ibos_alert, 'Internal Bearish BOS', 'Internal Bearish BOS formed')
alertcondition(bear_ichoch_alert, 'Internal Bearish CHoCH', 'Internal Bearish CHoCH formed')
//Swing Structure
alertcondition(bull_bos_alert, 'Bullish BOS', 'Internal Bullish BOS formed')
alertcondition(bull_choch_alert, 'Bullish CHoCH', 'Internal Bullish CHoCH formed')
alertcondition(bear_bos_alert, 'Bearish BOS', 'Bearish BOS formed')
alertcondition(bear_choch_alert, 'Bearish CHoCH', 'Bearish CHoCH formed')
//order Blocks
alertcondition(bull_iob_break, 'Bullish Internal OB Breakout', 'Price broke bullish internal OB')
alertcondition(bear_iob_break, 'Bearish Internal OB Breakout', 'Price broke bearish internal OB')
alertcondition(bull_ob_break, 'Bullish Swing OB Breakout', 'Price broke bullish swing OB')
alertcondition(bear_ob_break, 'Bearish Swing OB Breakout', 'Price broke bearish swing OB')
//EQH/EQL
alertcondition(eqh_alert, 'Equal Highs', 'Equal highs detected')
alertcondition(eql_alert, 'Equal Lows', 'Equal lows detected')
//FVG
alertcondition(bullish_fvg_cnd, 'Bullish FVG', 'Bullish FVG formed')
alertcondition(bearish_fvg_cnd, 'Bearish FVG', 'Bearish FVG formed')
//-----------------------------------------------------------------------------}

ICT XAUUSD Buy/Sell SignalsHere's a indicator that follows the ICT (Inner Circle Trader) concept to generate buy and sell signals accurately. It includes:
Buy & Sell signals based on ICT methodology.
Stop Loss (SL) at the previous swing high/low.
Take Profit (TP) at 1.5 times the risk.
A vertical line at the TP level on the left side of the screen.
This script is designed for XAUUSD on 30m, 1H, and 4H timeframes and reduces false signals by using liquidity sweeps and order blocks.
