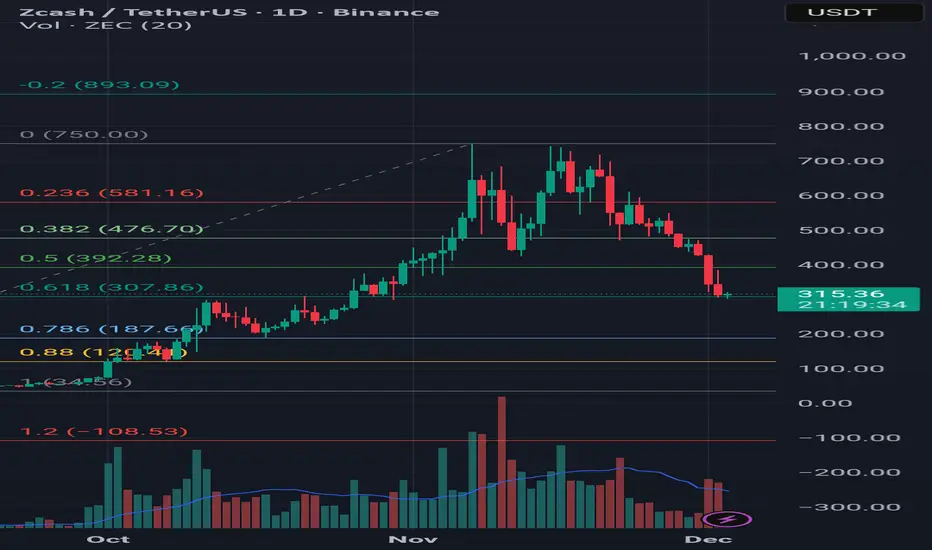
ZECUSDT – Potential Long Setup at Key Fibonacci Level
After a strong rally, ZECUSDT has entered a corrective phase, dropping from the 750 zone down to 307.8 – which aligns precisely with the 0.618 Fibonacci retracement level. Historically, this area has acted as a significant resistance twice, and once broken, it led to a notable bullish continuation.
Currently, price action is testing this level again, and given its historical importance, I see potential for a long setup if bullish confirmation appears.
📌 My Targets (TP):
- TP1: 470
- TP2: 658
- TP3: 743
🛡️ Stop Loss: 299
🕒 Timeframe: Daily
📈 Perspective: Long-term
⚠️ Disclaimer: This is not financial advice or a buy/sell signal. Just sharing my personal view based on technical analysis.
Pernyataan Penyangkalan
Informasi dan publikasi ini tidak dimaksudkan, dan bukan merupakan, saran atau rekomendasi keuangan, investasi, trading, atau jenis lainnya yang diberikan atau didukung oleh TradingView. Baca selengkapnya di Ketentuan Penggunaan.
Pernyataan Penyangkalan
Informasi dan publikasi ini tidak dimaksudkan, dan bukan merupakan, saran atau rekomendasi keuangan, investasi, trading, atau jenis lainnya yang diberikan atau didukung oleh TradingView. Baca selengkapnya di Ketentuan Penggunaan.