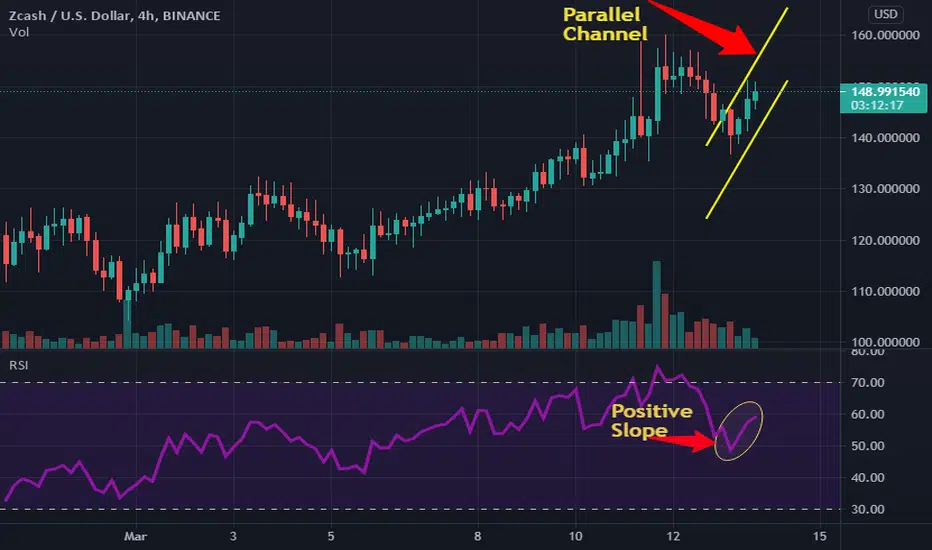
.The daily chart of ZEC hints at the start of a bullish move. On coming to the shorter time frame of 4 hours, the coin has formed a upward parallel channel. If the price breaks above 5% of the current position, it can see a rally upto $200 in upcoming trading sessions.ZEC price can also see a new low if it comes below the channel.
Kindly comment your thoughts below
Kindly comment your thoughts below
Publikasi terkait
Pernyataan Penyangkalan
Informasi dan publikasi tidak dimaksudkan untuk menjadi, dan bukan merupakan saran keuangan, investasi, perdagangan, atau rekomendasi lainnya yang diberikan atau didukung oleh TradingView. Baca selengkapnya di Persyaratan Penggunaan.
Publikasi terkait
Pernyataan Penyangkalan
Informasi dan publikasi tidak dimaksudkan untuk menjadi, dan bukan merupakan saran keuangan, investasi, perdagangan, atau rekomendasi lainnya yang diberikan atau didukung oleh TradingView. Baca selengkapnya di Persyaratan Penggunaan.