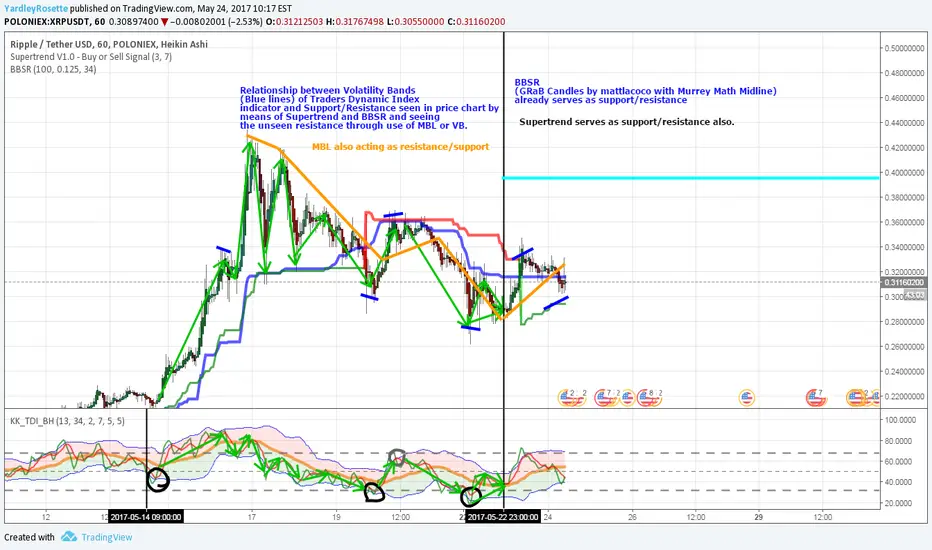
Chart presented shows behavior of lines related to price chart for better use (& understanding) of Traders Dynamic Index for whoever really cares about profiting.
Volatility Bands relate to the price chart showing price resistance or support at the moment.
Market BaseLine may show itself to be support or resistance.
Supertrend & BBSR serve as price chart indication of support or resistance.
RSI/TSI (Green/Red) cross at 32 or 50 while or after, or near crossing into VB lines serves as a powerful/advantageous entry depending also on a bit more of price chart analysis.
Catatan
This is/was not a trade analysis.Pernyataan Penyangkalan
Informasi dan publikasi tidak dimaksudkan untuk menjadi, dan bukan merupakan saran keuangan, investasi, perdagangan, atau rekomendasi lainnya yang diberikan atau didukung oleh TradingView. Baca selengkapnya di Persyaratan Penggunaan.
Pernyataan Penyangkalan
Informasi dan publikasi tidak dimaksudkan untuk menjadi, dan bukan merupakan saran keuangan, investasi, perdagangan, atau rekomendasi lainnya yang diberikan atau didukung oleh TradingView. Baca selengkapnya di Persyaratan Penggunaan.