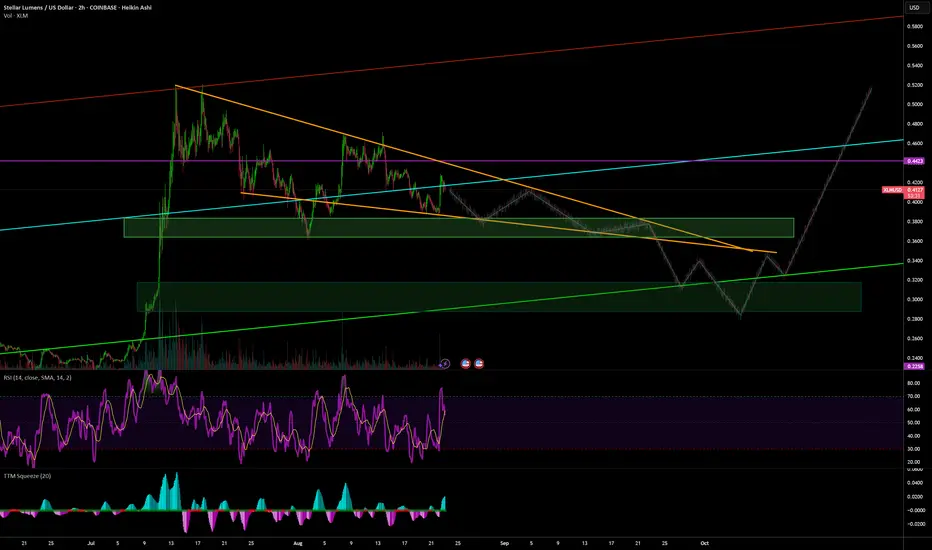
Overall it looks like a bull flag/ descending wedge, continuation pattern. Really it could keep going up from, especially after jackson hole speech. However, if I was looking for deep value entries, thre green boxes are the two I would buy at.
The first at .39 is the obvious (probably too obvious) entry. Break up from the descending wedge with target the top of the bullish channel.
The more likely and less obvious, due to ai and algorithms doing most of the trading now, they look for max pain and max liquidity, is the lower green box at about .29.
I think it breaks down from the channel to pick up liquidity, does an inverse head and shoulder then a V recovery. Probably happen at 3AM so set limit buys.
Really though, can't go wrong with DCA'ing the infrastructure for the next monetary system. If in doubt, just look at the board of directors and advisors for sdf.
stellar.org/foundation/team
Pernyataan Penyangkalan
Informasi dan publikasi tidak dimaksudkan untuk menjadi, dan bukan merupakan saran keuangan, investasi, perdagangan, atau rekomendasi lainnya yang diberikan atau didukung oleh TradingView. Baca selengkapnya di Persyaratan Penggunaan.
Pernyataan Penyangkalan
Informasi dan publikasi tidak dimaksudkan untuk menjadi, dan bukan merupakan saran keuangan, investasi, perdagangan, atau rekomendasi lainnya yang diberikan atau didukung oleh TradingView. Baca selengkapnya di Persyaratan Penggunaan.