Hi Guys,
The US indices all bounced after undercutting daily lows and perhaps trapping some short sellers who had taken the undercut as a break of a H & S pattern that was taking shape. A significant rally has ensued from the current low and the US 30 is heading towards an area that may see some resistance, perhaps enough to warrant a major correction.
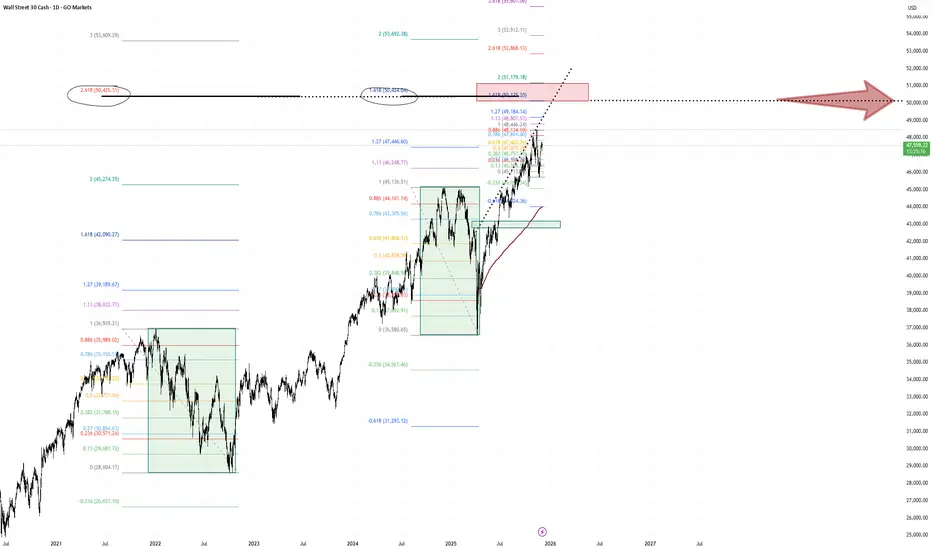
The red box on the chart is that area and there is good confluence to make it a possible trading zone to keep an eye on.
Firstly the fib retracement of the bear market high to low of 2.618 lands precisely within that area as does the 1.618 retrace of the tarrif correction from early this year. These are two significant fib measurements of two important events landing at precisely same location. The most recent daily high to low also has its 1.618 and 2.0 retrace land in that area (the former being the bottom of the red box, the latter being top of the red box.
Secondly what makes these measurements that much more important is that they both land at the 50000 mark. No need to say much more about this number being a highly likely trading zone.
Lastly there is an upper resistance trend line that the dow has had a few good reactions from which also leads into the mentioned area.
All in all there is good reason to suggest that we may get some good trading opportunities if the dow does reach the 50000 + mark.
Low risk high reward trades using lower time frames and chart pattern, candlestick patter, price could result in profitable trades . patience and sticking to whatever rules conditions that are set for your trading style/ strategy will be key.
Safe Trading all
The US indices all bounced after undercutting daily lows and perhaps trapping some short sellers who had taken the undercut as a break of a H & S pattern that was taking shape. A significant rally has ensued from the current low and the US 30 is heading towards an area that may see some resistance, perhaps enough to warrant a major correction.
The red box on the chart is that area and there is good confluence to make it a possible trading zone to keep an eye on.
Firstly the fib retracement of the bear market high to low of 2.618 lands precisely within that area as does the 1.618 retrace of the tarrif correction from early this year. These are two significant fib measurements of two important events landing at precisely same location. The most recent daily high to low also has its 1.618 and 2.0 retrace land in that area (the former being the bottom of the red box, the latter being top of the red box.
Secondly what makes these measurements that much more important is that they both land at the 50000 mark. No need to say much more about this number being a highly likely trading zone.
Lastly there is an upper resistance trend line that the dow has had a few good reactions from which also leads into the mentioned area.
All in all there is good reason to suggest that we may get some good trading opportunities if the dow does reach the 50000 + mark.
Low risk high reward trades using lower time frames and chart pattern, candlestick patter, price could result in profitable trades . patience and sticking to whatever rules conditions that are set for your trading style/ strategy will be key.
Safe Trading all
Trade aktif
Pernyataan Penyangkalan
Informasi dan publikasi ini tidak dimaksudkan, dan bukan merupakan, saran atau rekomendasi keuangan, investasi, trading, atau jenis lainnya yang diberikan atau didukung oleh TradingView. Baca selengkapnya di Ketentuan Penggunaan.
Pernyataan Penyangkalan
Informasi dan publikasi ini tidak dimaksudkan, dan bukan merupakan, saran atau rekomendasi keuangan, investasi, trading, atau jenis lainnya yang diberikan atau didukung oleh TradingView. Baca selengkapnya di Ketentuan Penggunaan.