In - depth: USOIL 1 - hr Chart - Significance of 60.00 Support
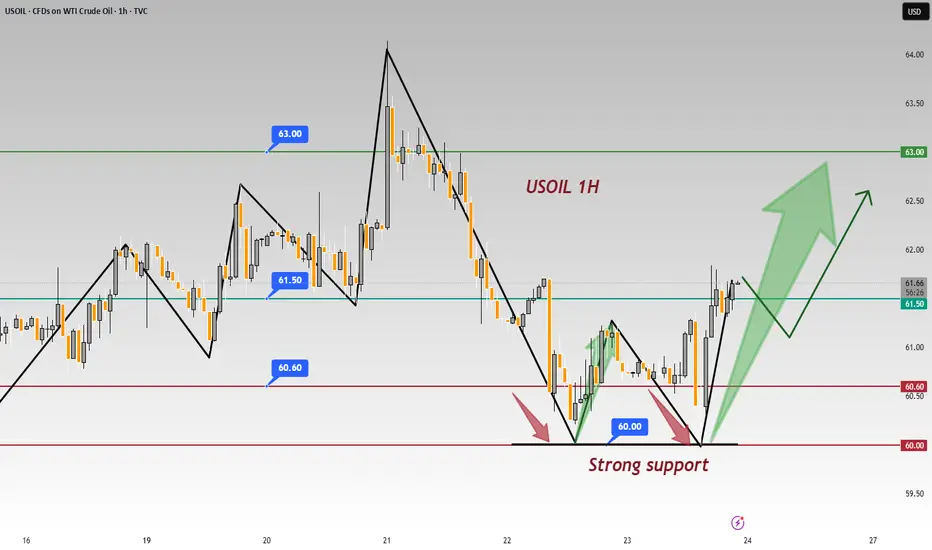
In the USOIL 1 - hour chart, 60.00 acts as a strong support 💪.
Support Validation
The price twice failed to break 60.00 and rebounded 📈. Psychologically, investors see 60.00 as a key level 🔑. Approaching it, buy orders pour in as they think crude oil is undervalued 📉. Technically, it's on a support line from prior lows, and repeated tests have fortified its support 🛡️.
⚡️⚡️⚡️ USOil ⚡️⚡️⚡️
🚀 Buy@ 60.00 - 60.60
🚀 TP 62.50 - 62.80
Accurate signals are updated every day 📈 If you encounter any problems during trading, these signals can serve as your reliable guide 🧭 Feel free to refer to them! I sincerely hope they'll be of great help to you 🌟 👇
Trade aktif
The price twice failed to break 60.00 and rebounded,Psychologically, investors see 60.00 as a key level,Let's look forward to Monday!Publikasi terkait
Pernyataan Penyangkalan
Informasi dan publikasi tidak dimaksudkan untuk menjadi, dan bukan merupakan saran keuangan, investasi, perdagangan, atau rekomendasi lainnya yang diberikan atau didukung oleh TradingView. Baca selengkapnya di Persyaratan Penggunaan.
Publikasi terkait
Pernyataan Penyangkalan
Informasi dan publikasi tidak dimaksudkan untuk menjadi, dan bukan merupakan saran keuangan, investasi, perdagangan, atau rekomendasi lainnya yang diberikan atau didukung oleh TradingView. Baca selengkapnya di Persyaratan Penggunaan.